


S&P 500 has fallen for six consecutive days, can the market still be good?
Deutsche Bank stated that historically, the median performance within one month after a six consecutive drop in the S&P is +3.5%
Last Friday, US tech stocks experienced a "Black Friday", with the S&P 500 index falling for six consecutive trading days for the first time in a year and a half, marking the worst weekly performance since the risk of Silicon Valley bank collapse in March last year.
Accompanied by the peak of the US stock earnings season, the S&P ended the six-day losing streak on Monday, closing up 0.87% at 5010.60 points.
Next, can the US stock market continue its early-year rally?
On April 22, Deutsche Bank released a new research report analyzing the six consecutive trading days of decline in the S&P 500 index and predicting the future market trend.
Deutsche Bank pointed out that the six-day decline of the S&P 500 index is the ninth time this situation has occurred in nearly ten years, averaging less than once a year, and stated:
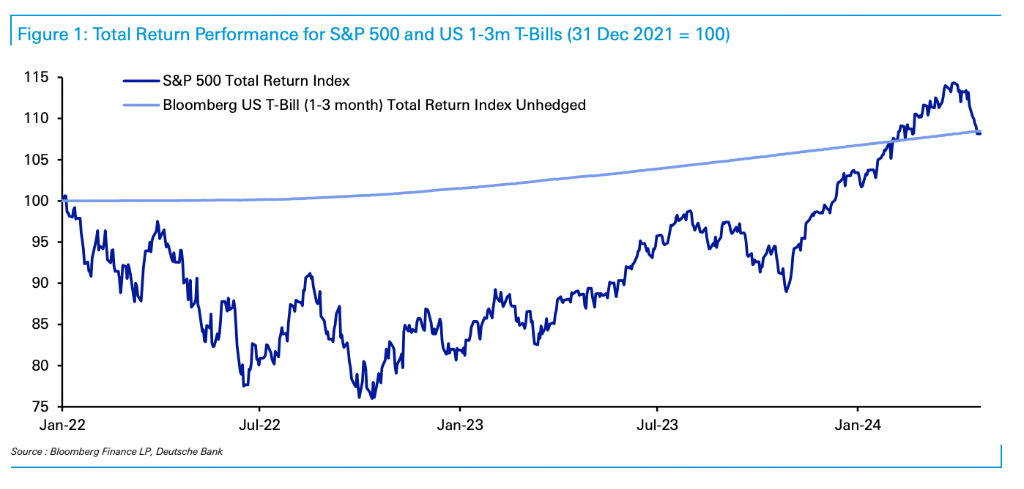
Since the end of 2021, the overall return of US 1-3 month Treasury bills has exceeded the S&P 500 index.
Deutsche Bank believes that the main factors leading to the market decline this time are twofold: first, the escalation of the situation in the Middle East has driven risk aversion, and second, with inflation still sticky, the market expects the Fed interest rates to remain high for a longer period of time.
Looking ahead, Deutsche Bank remains optimistic overall, believing that the S&P is likely to regain its upward momentum.
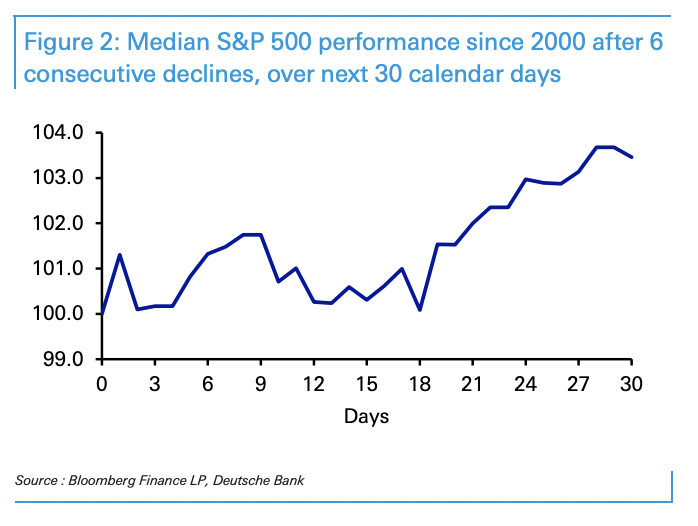
The report stated that historically, after a six-day decline, the S&P has often achieved steady growth in the following period, with a median performance of +3.5% within a month.
Since 2000, the S&P 500 index has experienced six consecutive declines 17 times.
Looking at the historical performance of the median in one month, the S&P is expected to remain relatively stable in the coming weeks, but a stronger rebound is expected later this month. Out of the 17 rebounds, 12 turned positive after 30 days.
Looking at the historical performance of the median in six months, most also show a positive trend.
Of course, there are some exceptions, but whether looking at a time span of 1 month, 3 months, or 6 months, the index mostly shows a steady increase in the subsequent period.
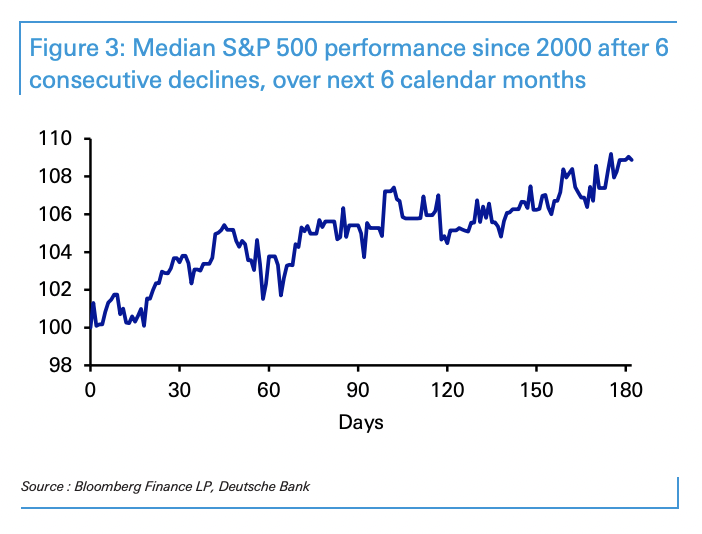
In conclusion, the report states that based on historical performance, a six consecutive drop in the S&P index does not necessarily mean it will continue to fall, and there is potential for a steady recovery in the next 6 months