
March Social Zero Review: Was the consumption hot during the Spring Festival, but now cold? Which one is the truth
The National Bureau of Statistics released macroeconomic data for March 2024 today. The unexpectedly strong social retail data for January and February seemed to indicate an upward trend in domestic consumption, but the momentum in March took a 180-degree turn, unexpectedly weakening. While overall data growth for the first quarter is good, the widespread and comprehensive weakening in March is puzzling. Whether the misalignment of the consumption cycle in March is the main reason remains a key issue that needs further verification.
1. Did the sudden downturn in social retail growth in March result from a misalignment in the consumption cycle or other main reasons?
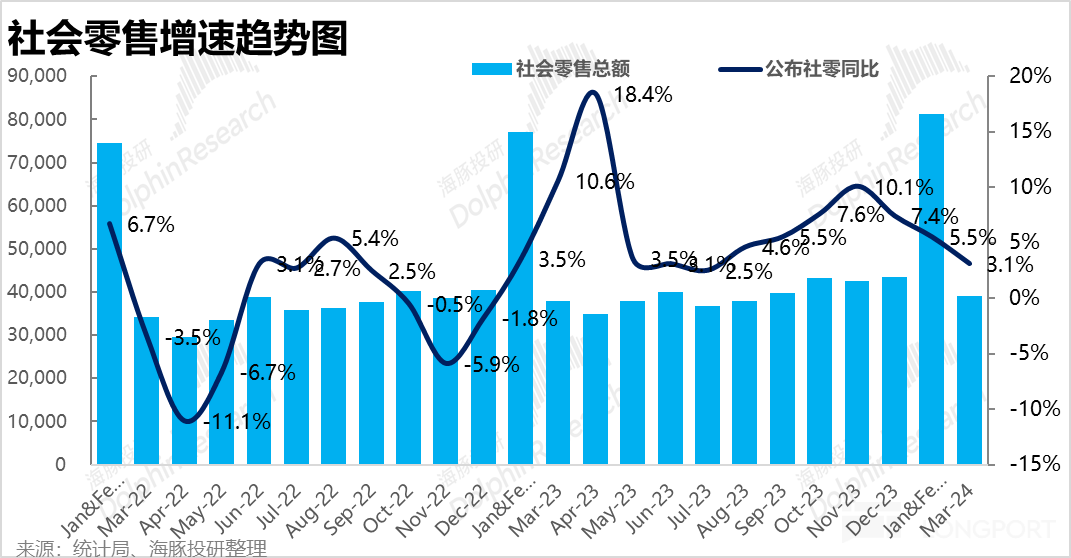
Overall, the total social retail sales in March 2024 were around 39 trillion yuan, with a year-on-year growth of 3.1%. According to Wind statistics, the market generally expected a growth rate of over 4%, so the actual growth appears to have significantly underperformed expectations.
Excluding the impact of the high base effect after the lifting of restrictions last year and the low credibility of "market expectations," compared to March 2021, the compound growth rate of social retail in March was 3.2%, showing a slowdown from the 5.2% growth in January and February.
Although there was a noticeable decline in domestic consumption sentiment in March, the overall social retail growth for the first quarter increased by 4.6% compared to the same period in 2021, marking the highest quarterly (compound) growth rate since 2022 based on 2021. Therefore, it is possible that actual consumption was not as strong as indicated in January and February, nor as weak as in March. The simplest and most likely explanation is that most consumption demand was concentrated during the Spring Festival period. However, the apparent weakening trend in March should be closely monitored to prevent risks.
2. The apparent weakness in online retail is not the main culprit
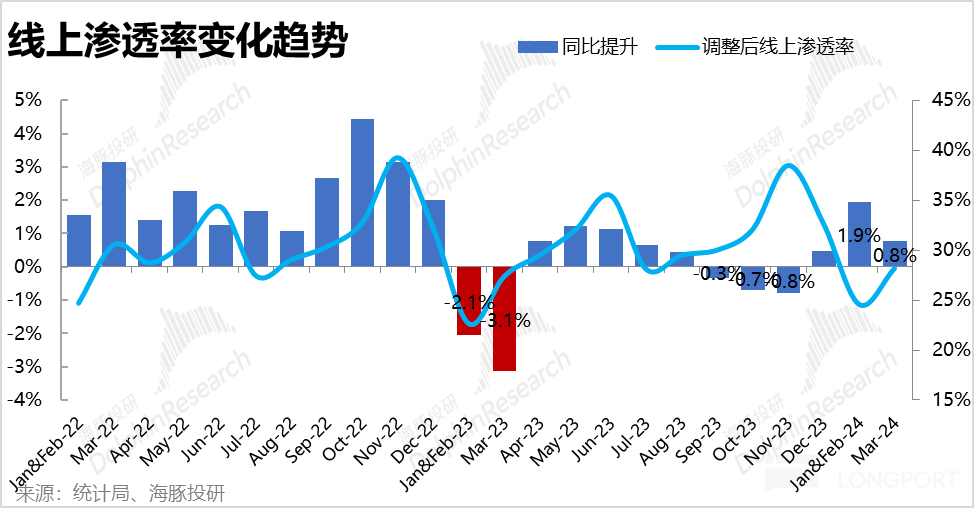
Compared to the overall retail landscape, the fluctuations in the growth rate of online physical retail sales are more pronounced and at first glance, appear to be the main driver of the weakening in the broader retail market. According to the data released by the Statistical Bureau without adjustment, the growth rate of online physical retail sales in March turned negative to -4.9%, which is counterintuitive and thus overlooked. After adjusting for previous base effects, the growth rate for online physical retail in March was 6.8%, a significant drop from the robust 14.4% in January-February.
Even after smoothing with the 2021 baseline, the compounded growth rate of 4.5% in March for online physical sales also shows a substantial decrease from 7.7% in January-February.
At first glance, it seems that the significant weakening of online sales dragged down the overall retail sector. However, after adjustments, the online physical penetration rate in March increased by 0.8 percentage points year-over-year. Therefore, despite not being impressive, online physical retail growth still plays a role in driving overall retail sales.
Summarizing the first quarter, the growth rate of online physical retail compared to the compound growth rate of 6.5% in 2021 and the growth rate of the last quarter of the previous year remains consistent, offsetting the volatility of high earlier and low later periods, showing that the trend in online retail has neither improved nor worsened.
3. Apart from catering, all retail channels experienced a decline in growth in March.
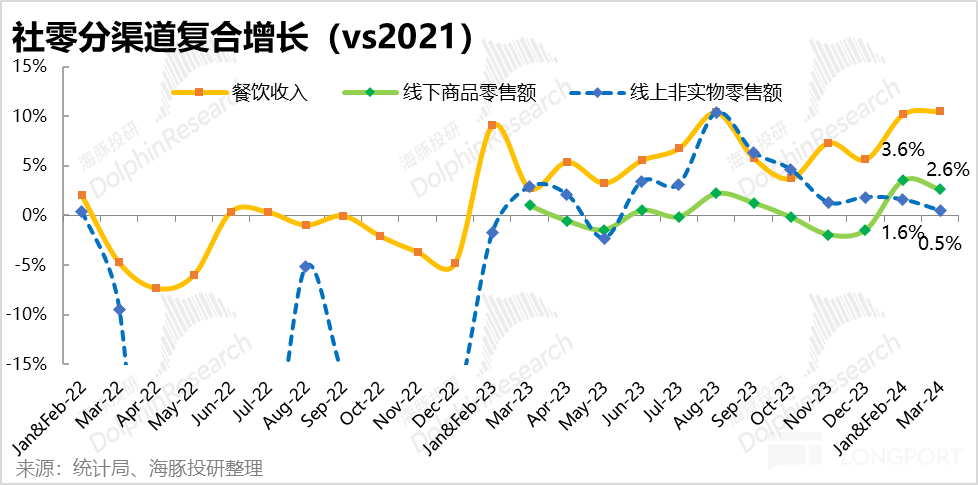
In other retail consumption channels, it can be seen that compared to the compound growth rate of 10.5% in 2021, catering revenue in March remained stable, showing no signs of weakening.
Except for catering, the compound growth rate of offline commodity retail slowed down from 3.6% in January-February to 2.6%, and the compound growth rate of non-physical online retail also decreased from 1.6% in the previous reporting period to -2.8% (note that this is an unadjusted measure, under which online physical retail also experienced negative growth, so the actual situation should not be as bad).
Therefore, the weakening of consumption in various channels in March is widespread and comprehensive. However, it is important to note that the weakening in March is mainly due to the mismatch in the overall consumption release rhythm of the first quarter, and whether this trend will continue is an important issue to observe.
4. Is the collapse in car sales the main culprit?
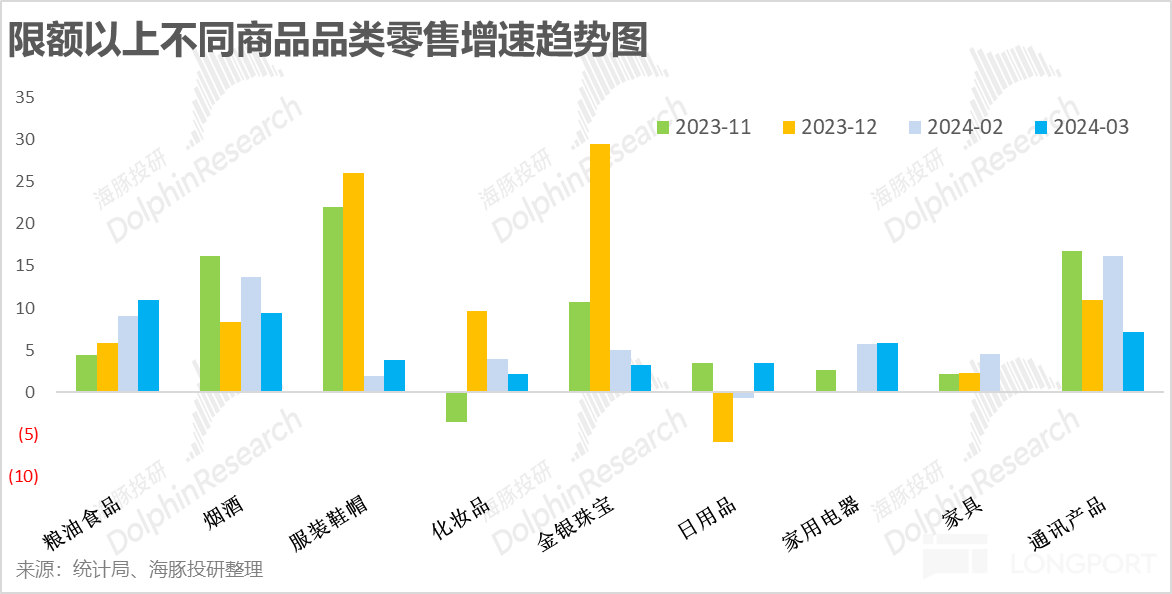
Looking at different product categories, after entering the period of high base numbers from last year, the growth rate of discretionary items such as clothing, shoes, and hats had already begun to decline noticeably in January and February. However, comparing the two reporting periods of January-February and March, the categories that saw a significant weakening in growth rate on a month-to-month basis were mainly tobacco, alcohol, jewelry, and communication products. This aligns with the recent trend of weakening wholesale prices for baijiu and the noticeable decline in mobile phone shipments.
However, these categories do not constitute a large proportion of social retail, and categories with higher proportions such as food, grains, daily necessities, clothing, shoes, hats, and household appliances have good growth rates, with many showing an increase in growth rate compared to the previous period, which is not enough to explain the significant weakening of social retail.
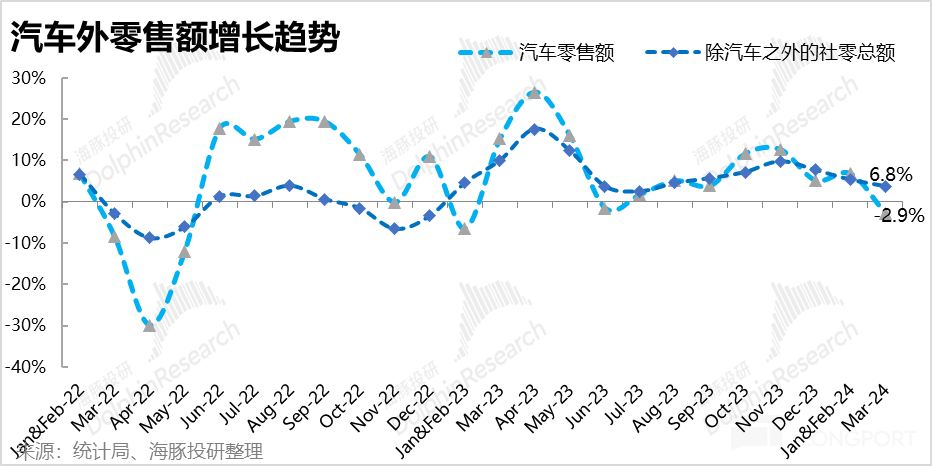
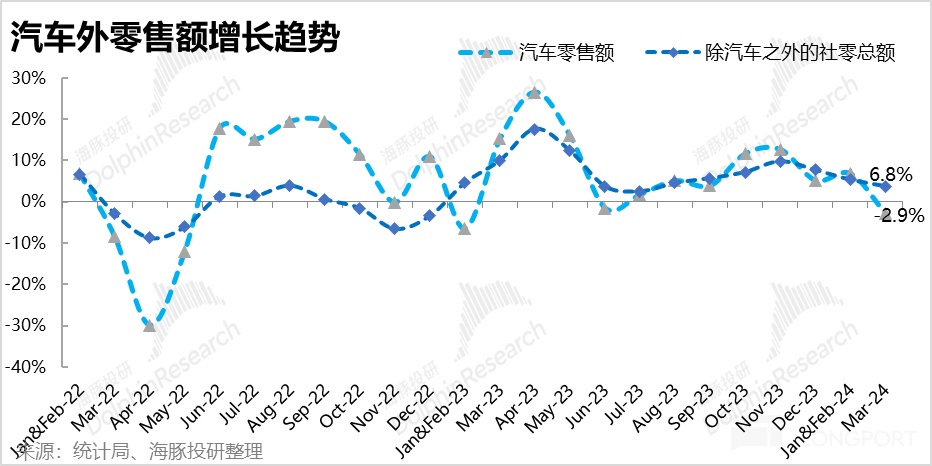
The largest single category, automobile retail (which accounts for one-fourth of total retail sales above the quota), saw its growth rate in March drop from 6.8% to -2.9%, making it the main "culprit" for the overall weakening of social retail this month. With the real estate sales, the former pillar, still not picking up, whether the automobile industry, as the second largest single industry, can provide support will be a decisive factor in whether subsequent consumption can pick up
Risk disclosure and statement for this article: Dolphin Investment Research Disclaimer and General Disclosure