
Global valuation recovery? There are also challenges in performance verification.
Hi guys, I'm Dolphin Analyst.
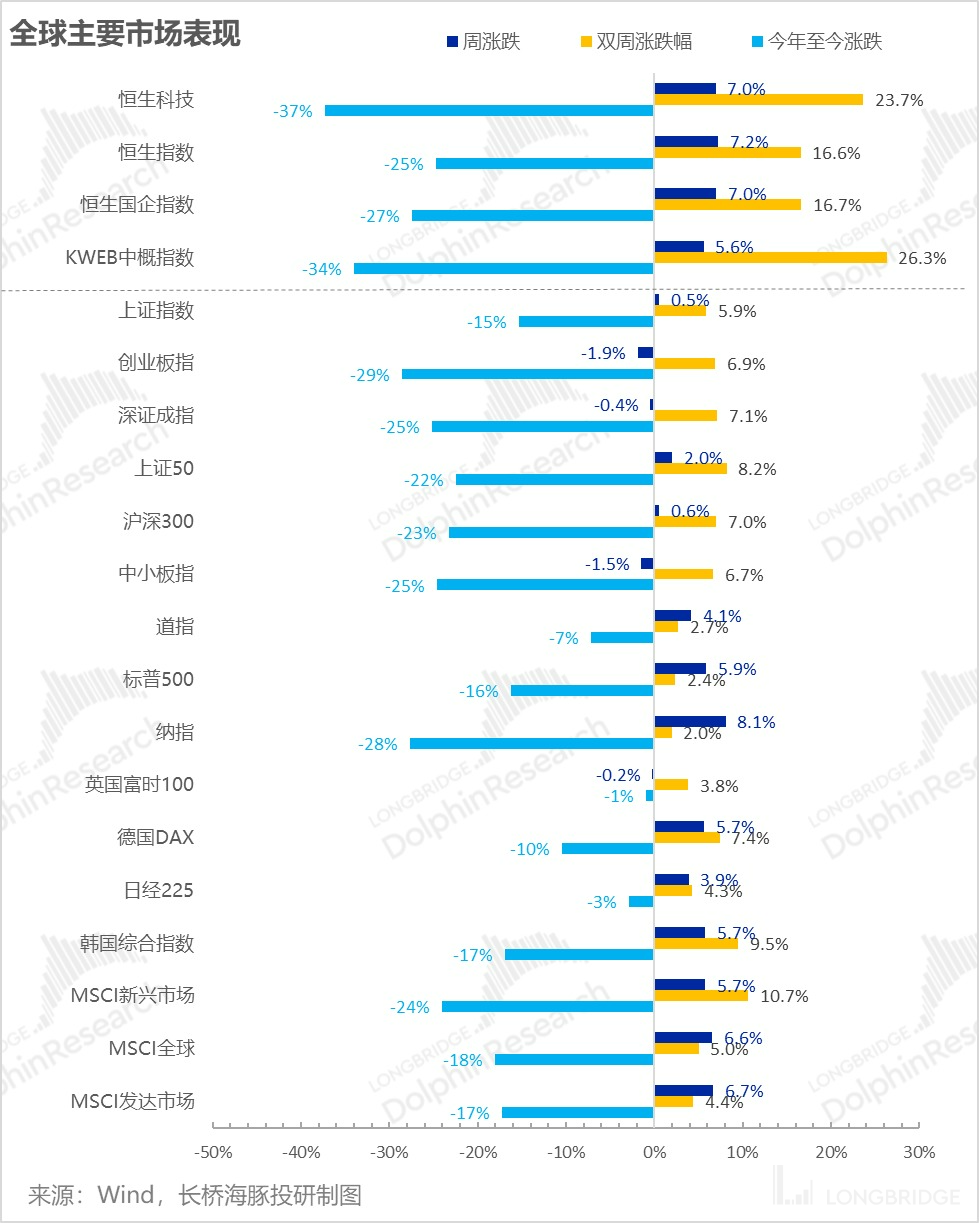
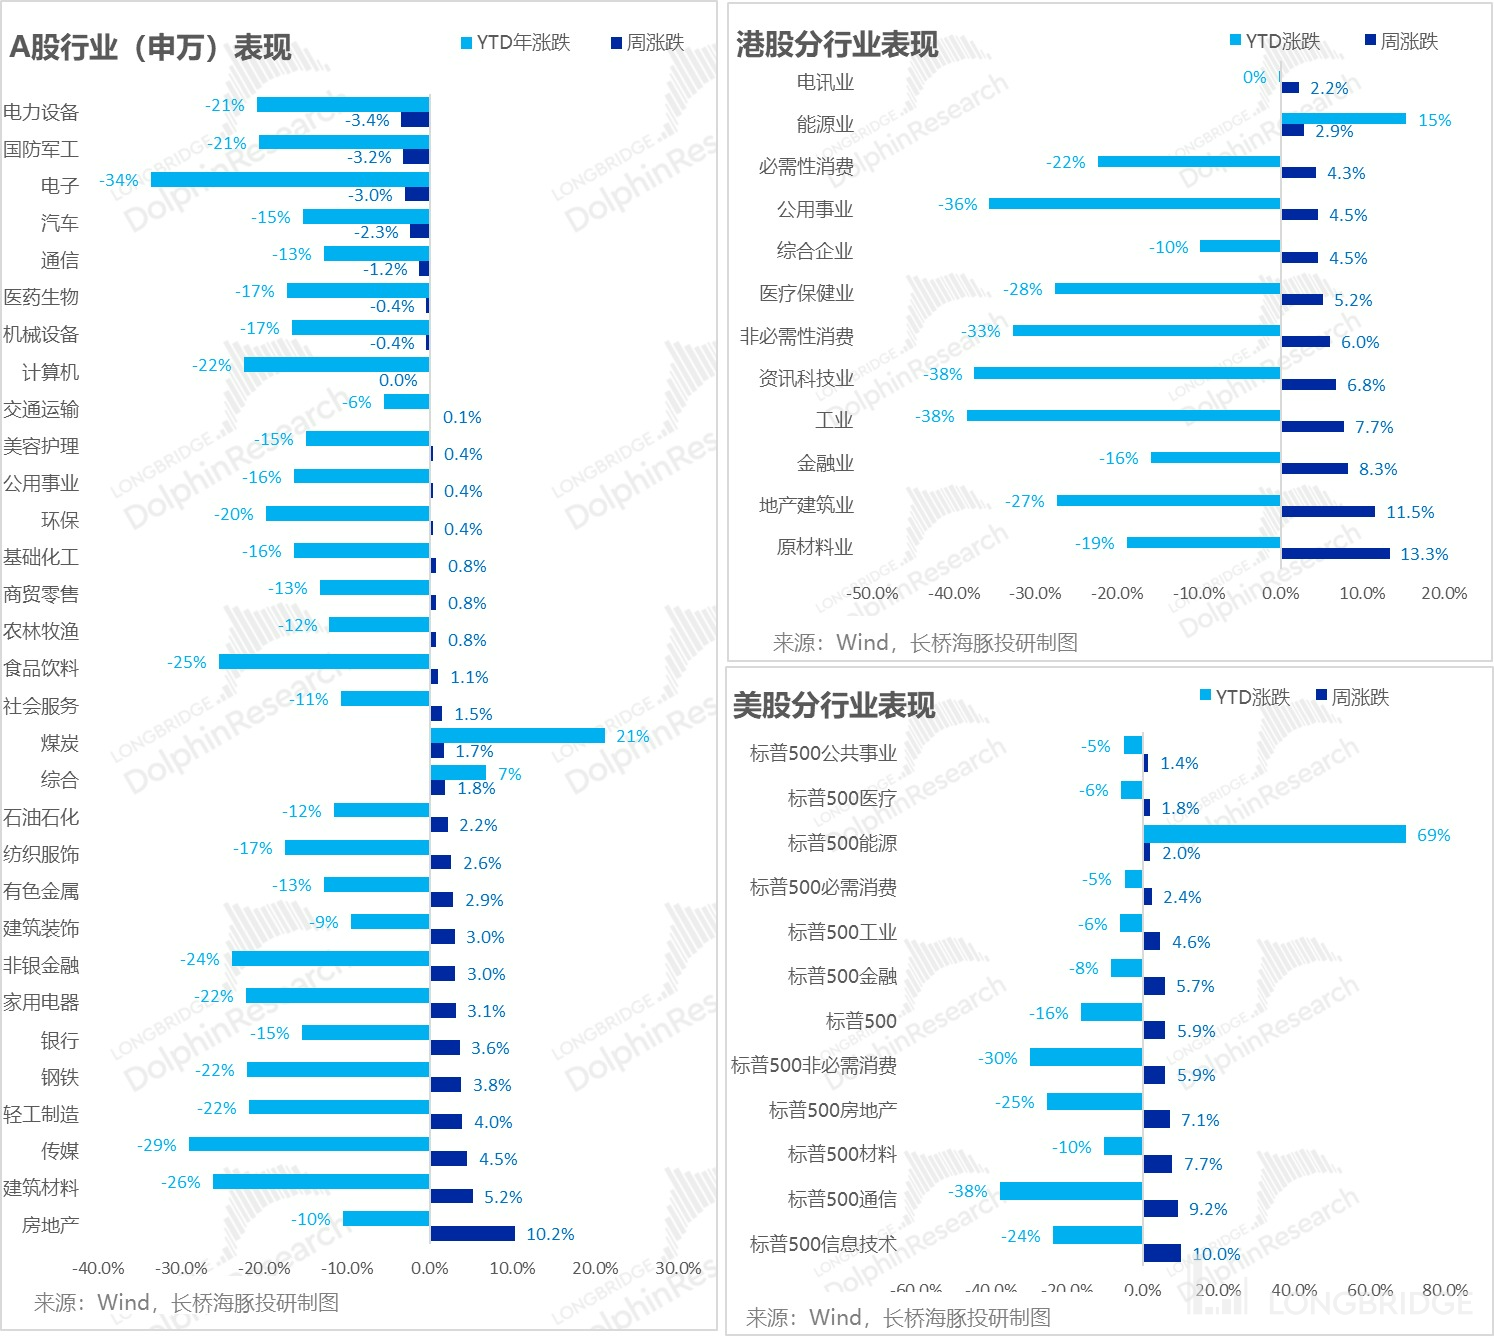
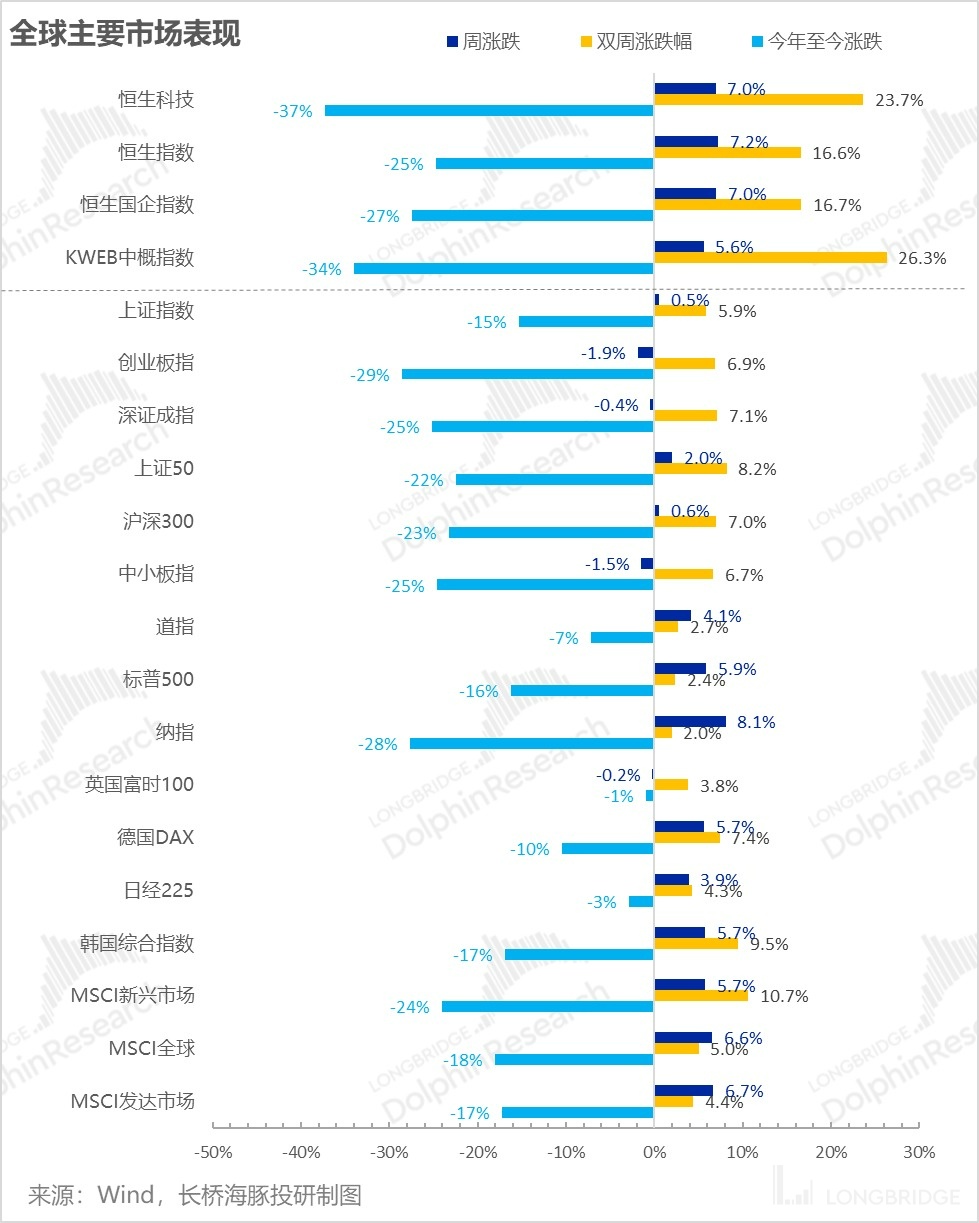
If a couple of weeks ago Hong Kong stocks were leading the charge for a violent recovery in response to expectations of U.S. interest rate hikes, last week it turned into a global market frenzy.
Especially the Hang Seng Tech Index, which has almost become the "most demonic" stock index globally, rebounded violently by 24% in two weeks. Considering the firm inflows into the stock market during the downturn, it is safe to say that this round of the game has firmly held the pricing power.
The key data behind last week's bullish market sentiment is the crucial factor that has been influencing global market trends this year: U.S. inflation.
I. Inflation inflection point, here it comes?
Let's first talk about the current inflation issue. What the market mainly focuses on is: (1) Energy and food are not the focus, especially in the absence of major global political and economic black swans, the path of declining energy demand and stabilizing food prices is relatively clear. (2) Sticky inflation focuses on core CPI, and the contradiction lies in core services, where goods account for a relatively low proportion and demand has clearly weakened, while services account for a high proportion and have been in a continuous upward trend.
(3) Year-on-year comparison is not important. In the year-on-year comparison, there are old price hike factors, while the new price hike factors are reflected in the month-on-month comparison. Only when the month-on-month growth rate slows down and even decreases slowly, can the year-on-year comparison slowly enter the moderation channel.
Combining these three points, the monthly CPI data, in fact, the core focus is the month-on-month change value of core services.
The main sub-items of core services are: Housing (33%), Medical services (7%), Transportation services (6%), Entertainment services (3%), Education and communication services (5%); of which, housing and medical services have obvious statistical problems.
a. Housing is composed of equivalent rent adjusted from rent and owner-occupied housing, of which rent prices are composed of new and renewal rents. Renewal contracts, as the house is usually renewed regularly every year, lag behind the market price, and landlords usually do not match the market price of new rental housing, as both tenants and landlords have the cost of moving and replacing.
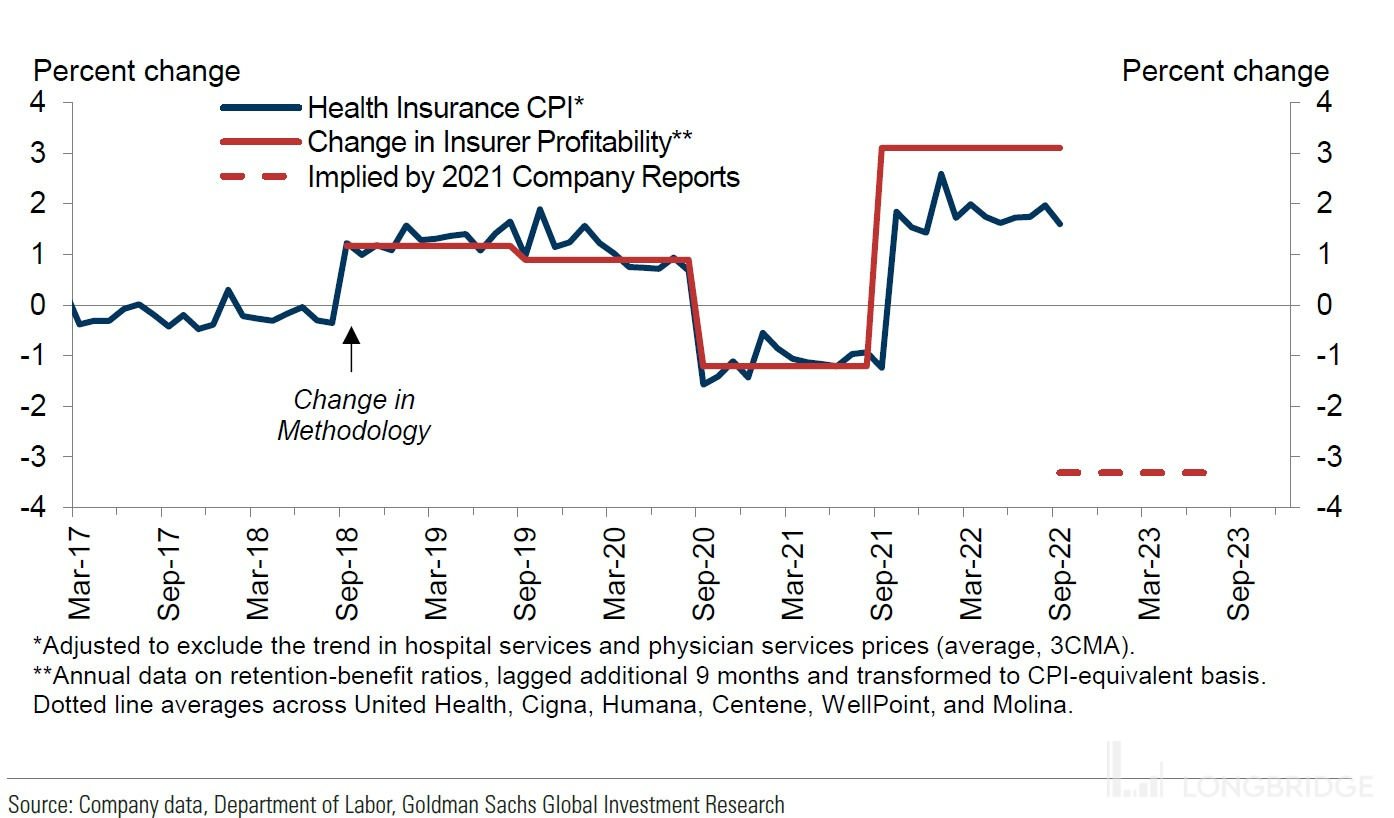
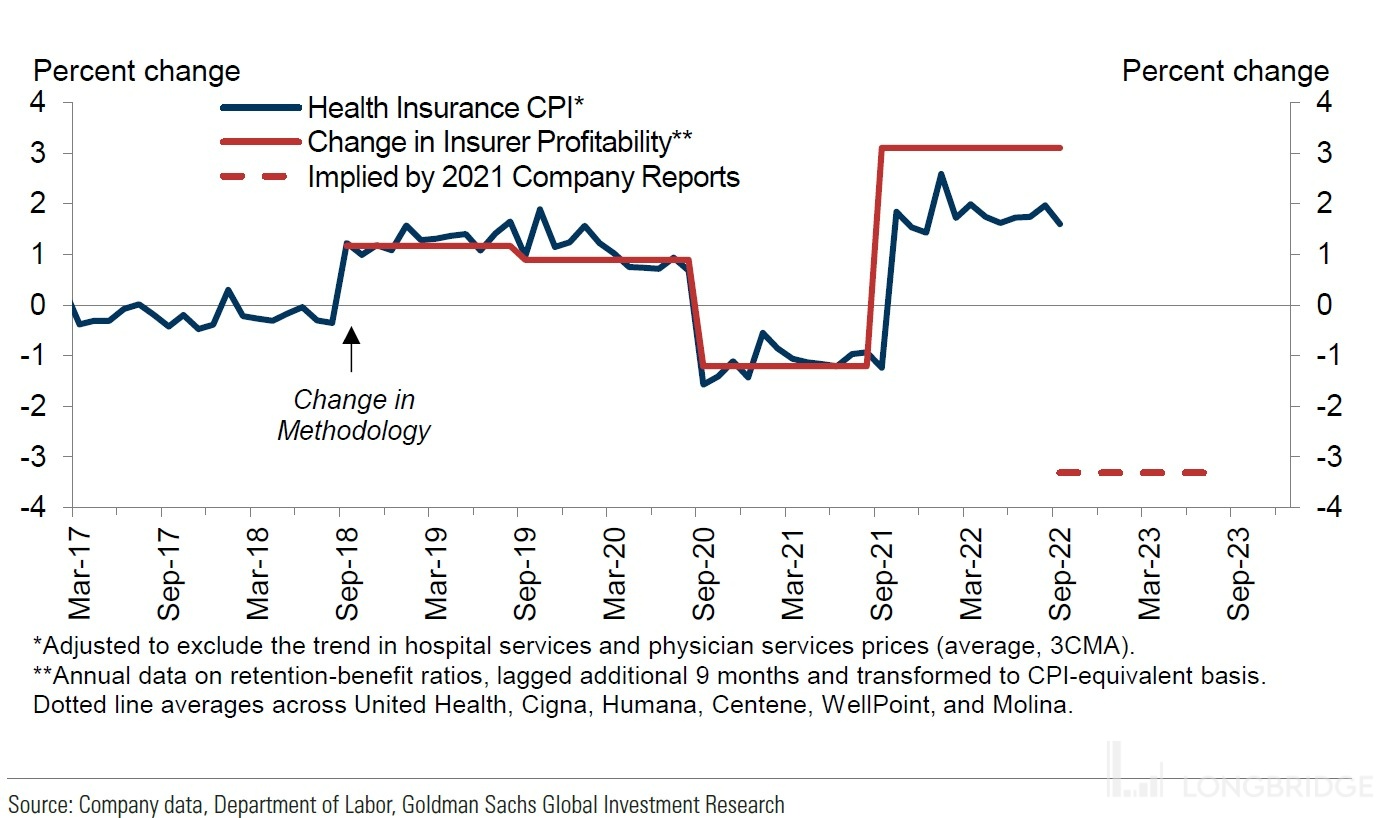
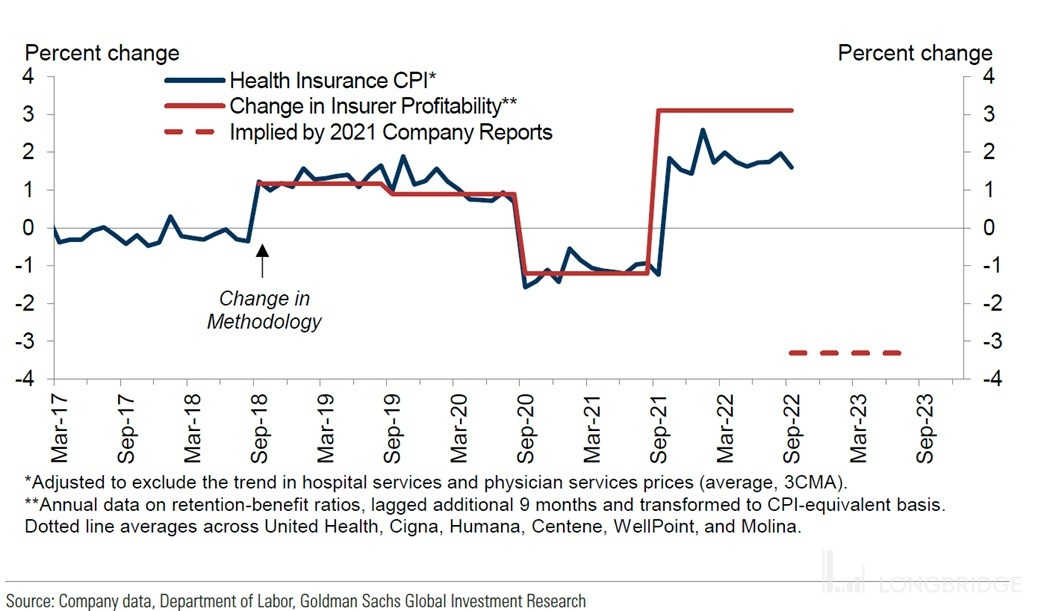
b. For medical services, the price of medical insurance is calculated based on the insurer's profit, and the base is updated once a year. The update data is also relatively lagging. For example, before October this year, the inflation of medical insurance was calculated based on the accumulated profits from 2020. Starting from October, the accumulated profits of insurance companies in 2021 were introduced as a reference for insurance prices, which led to the relative lag of CPI data for medical insurance.
However, this epidemic distorted the profit of insurance companies. During the epidemic period before Omicron (the end of 2021), the policy price remained stable, but the number of users seeking medical treatment decreased due to fear of infection, resulting in lower claims and abnormally high profits for insurance companies. After the epidemic, the profits of insurance companies decreased significantly. Starting from October, the accumulated profits of insurance after the decline began to be used as a reference for insurance prices, which led to the relative lag of CPI data for medical insurance.
Looking at October's data, we can quickly identify problems:
(1) The largest service expense--residential prices, despite the price lag effect, the price-to-price ratio is still growing rapidly, contributing the most to the month-on-month CPI increase;
(2) The second item in service prices--medical insurance has fallen sharply on a month-on-month basis, and according to the aforementioned unified base adjustment, it will continue to contribute negative growth for the rest of the year;
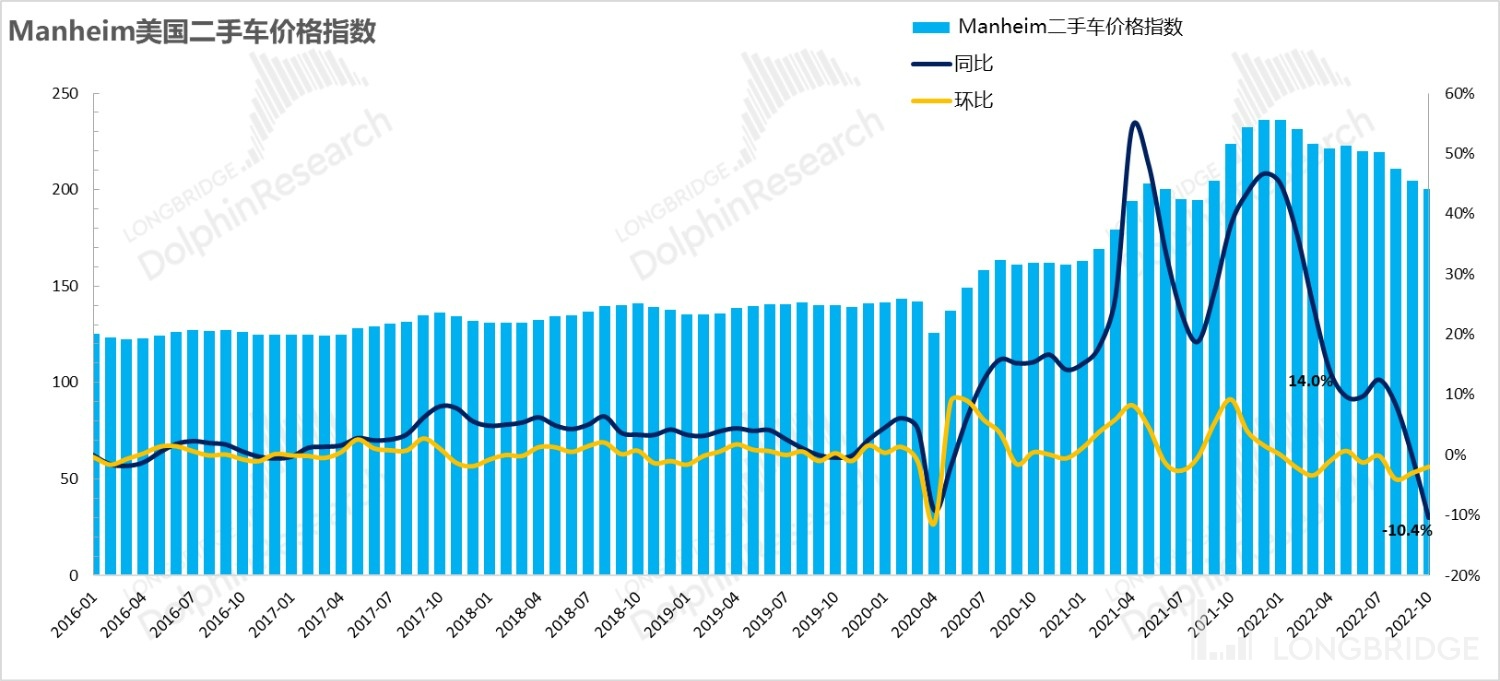
Furthermore, the largest deflation item in commodities--the significant drop in used car prices in October--also drove the drop in CPI, but this decline was largely expected and primarily due to the continuous decline in trading prices in the used car market. The trend of used cars in CPI is also relatively consistent with this.
Therefore, overall, excluding the outlier of medical services, the core issue is still the rapid decline in demand for commodities, with a slowdown in demand for services, but the trend will be slower. As the growth rate of CPI slows down, more and more pressure will focus on the supply and demand relationship of the labor market and the correlation between wage inflation and CPI position.
And in relative terms, the expected end point for the market's interest rate increase--5%-5.5%--is already quite sufficient, as predicted by the Dolphin Analyst, and the core issue remaining is how long the high interest rate will last and how it will affect individual stock performance. After the current wave of valuation correction in the US stock market, we still need to pay attention to the risk of subsequent business performance declines.
As a Hong Kong stock market that is dependent on US dollar liquidity and domestic economic expectations, last week it welcomed multiple positive releases while being in an extreme undervaluation situation:
-
Inflation data indicates that the expected interest rate increase may have already been fully priced in, and the strong US dollar plus the restoration of the renminbi exchange rate marks the end of the stage of liquidity being drawn from the market;
-
New epidemic prevention and control policies focus on more "precise" policy execution;
-
Financing policies for real estate have further marginally improved.
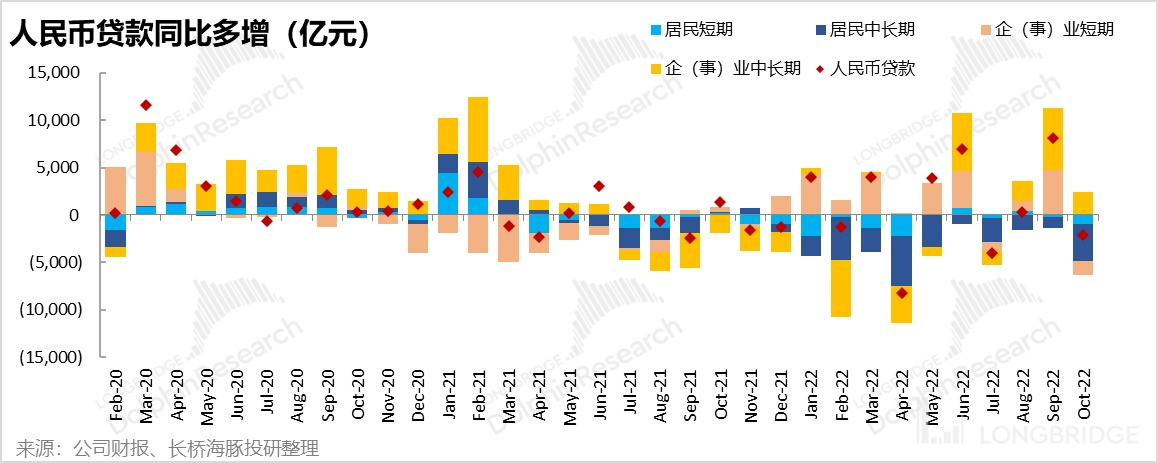
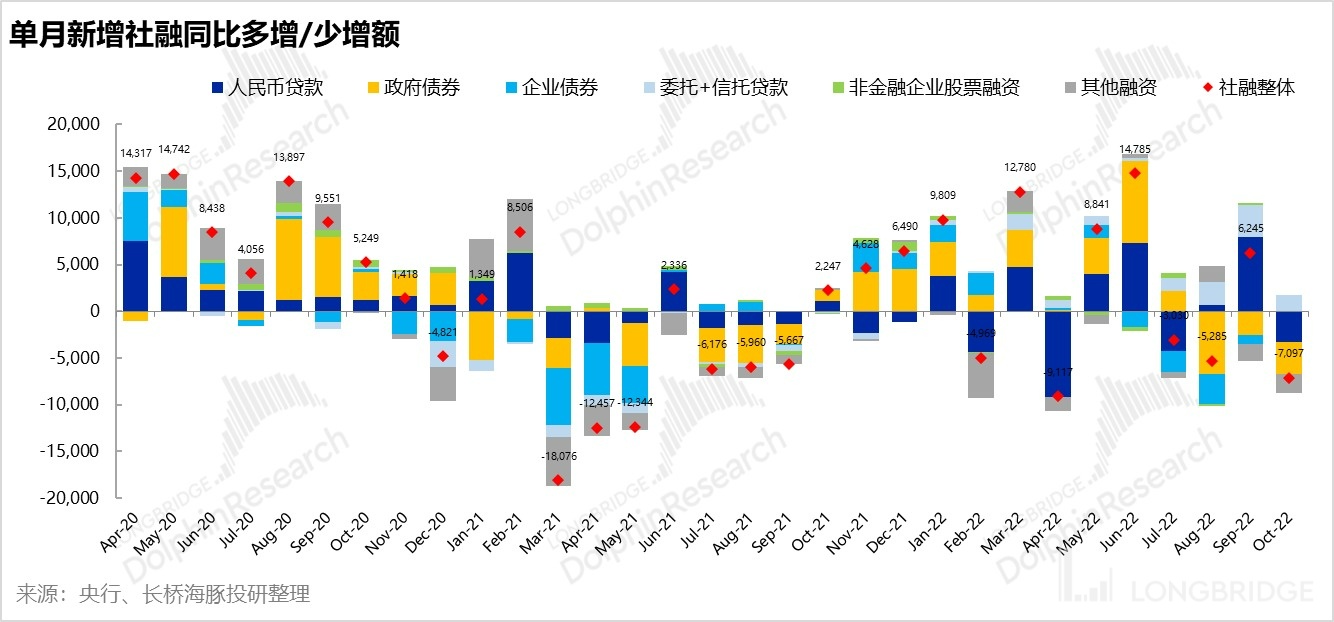
Thus, despite the unfavorable conditions of October's social financing (which relies solely on non-standard loans such as entrusted loans/trust loans to provide YoY increments) and the addition of new renminbi loans (which were lower than expected and still has weak demand for residential loans--resulting in net repayment once again, only sustained by long-term loans for enterprises and institutions), A shares also experienced a significant recovery.

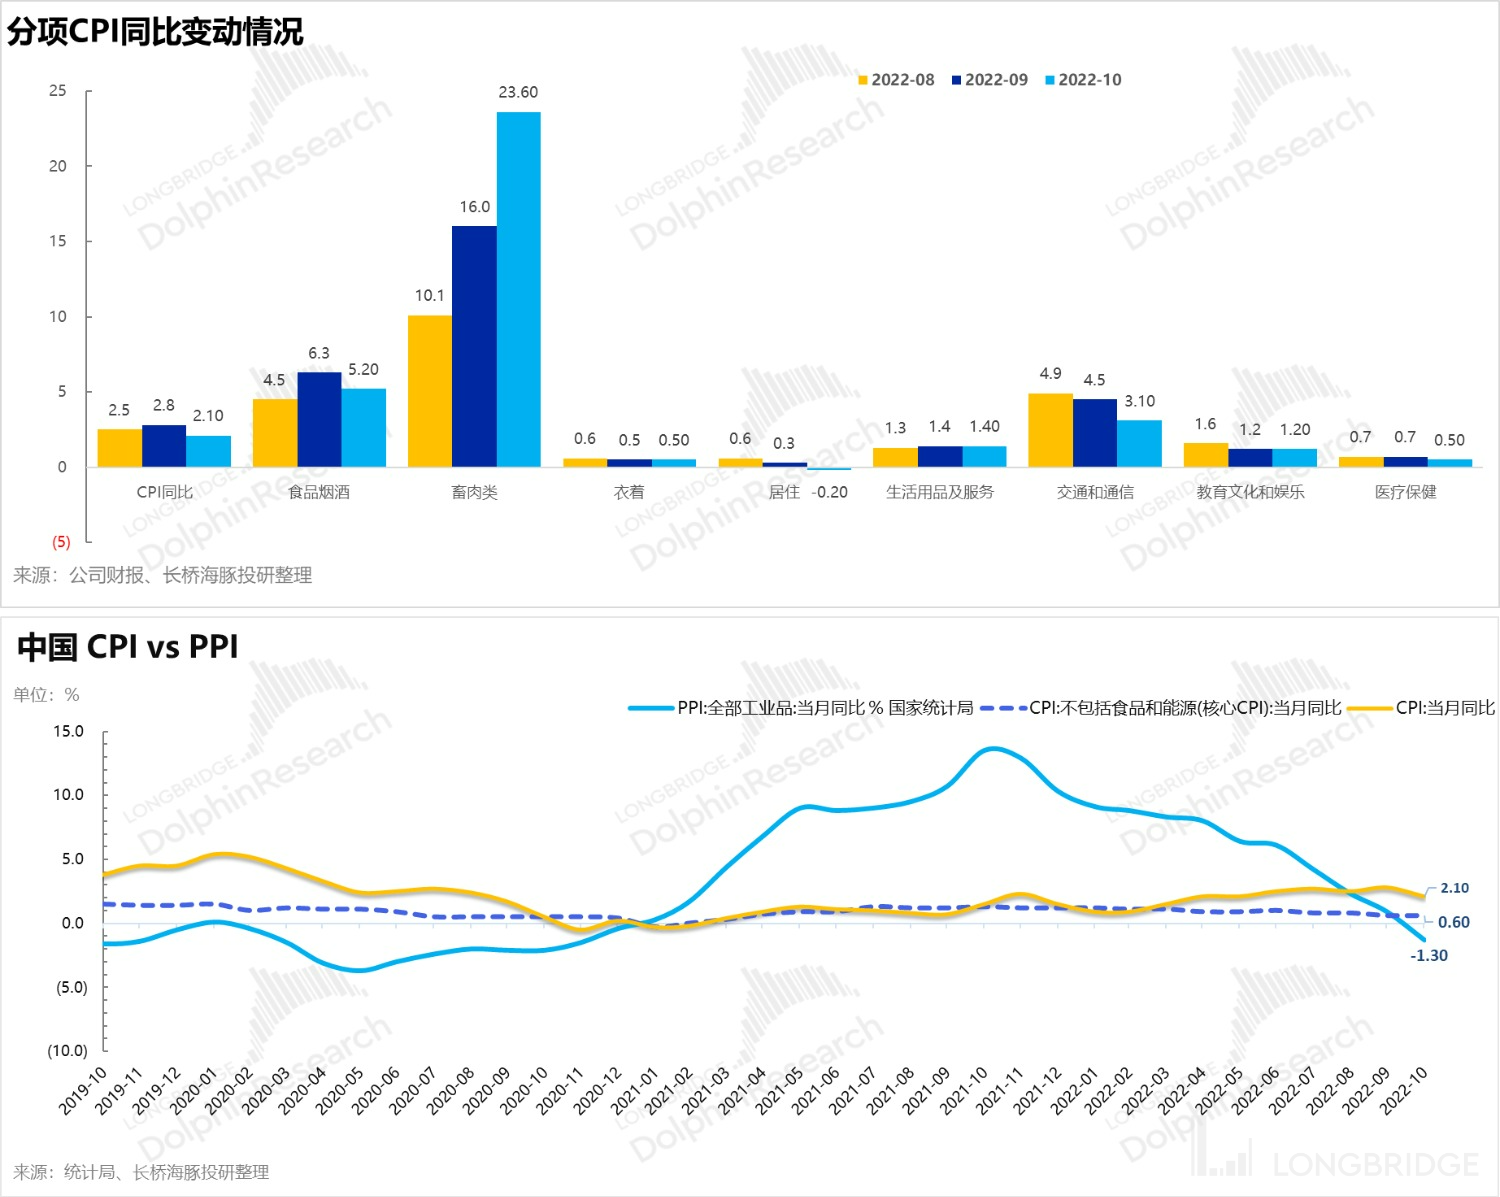
Moreover, from the perspective of CPI in China, there seems to be no need to worry about inflation: the core CPI in China, excluding food and energy, only increased by 0.6% YoY, indicating a continuous trend of deflation. With negative YoY producer prices, it has relieved the inflation pressure on residents. At the same time, as the hot weather has ended, the prices of fresh vegetables and fruits have fallen, with only pork prices remaining high.

2. The Carnival of Release
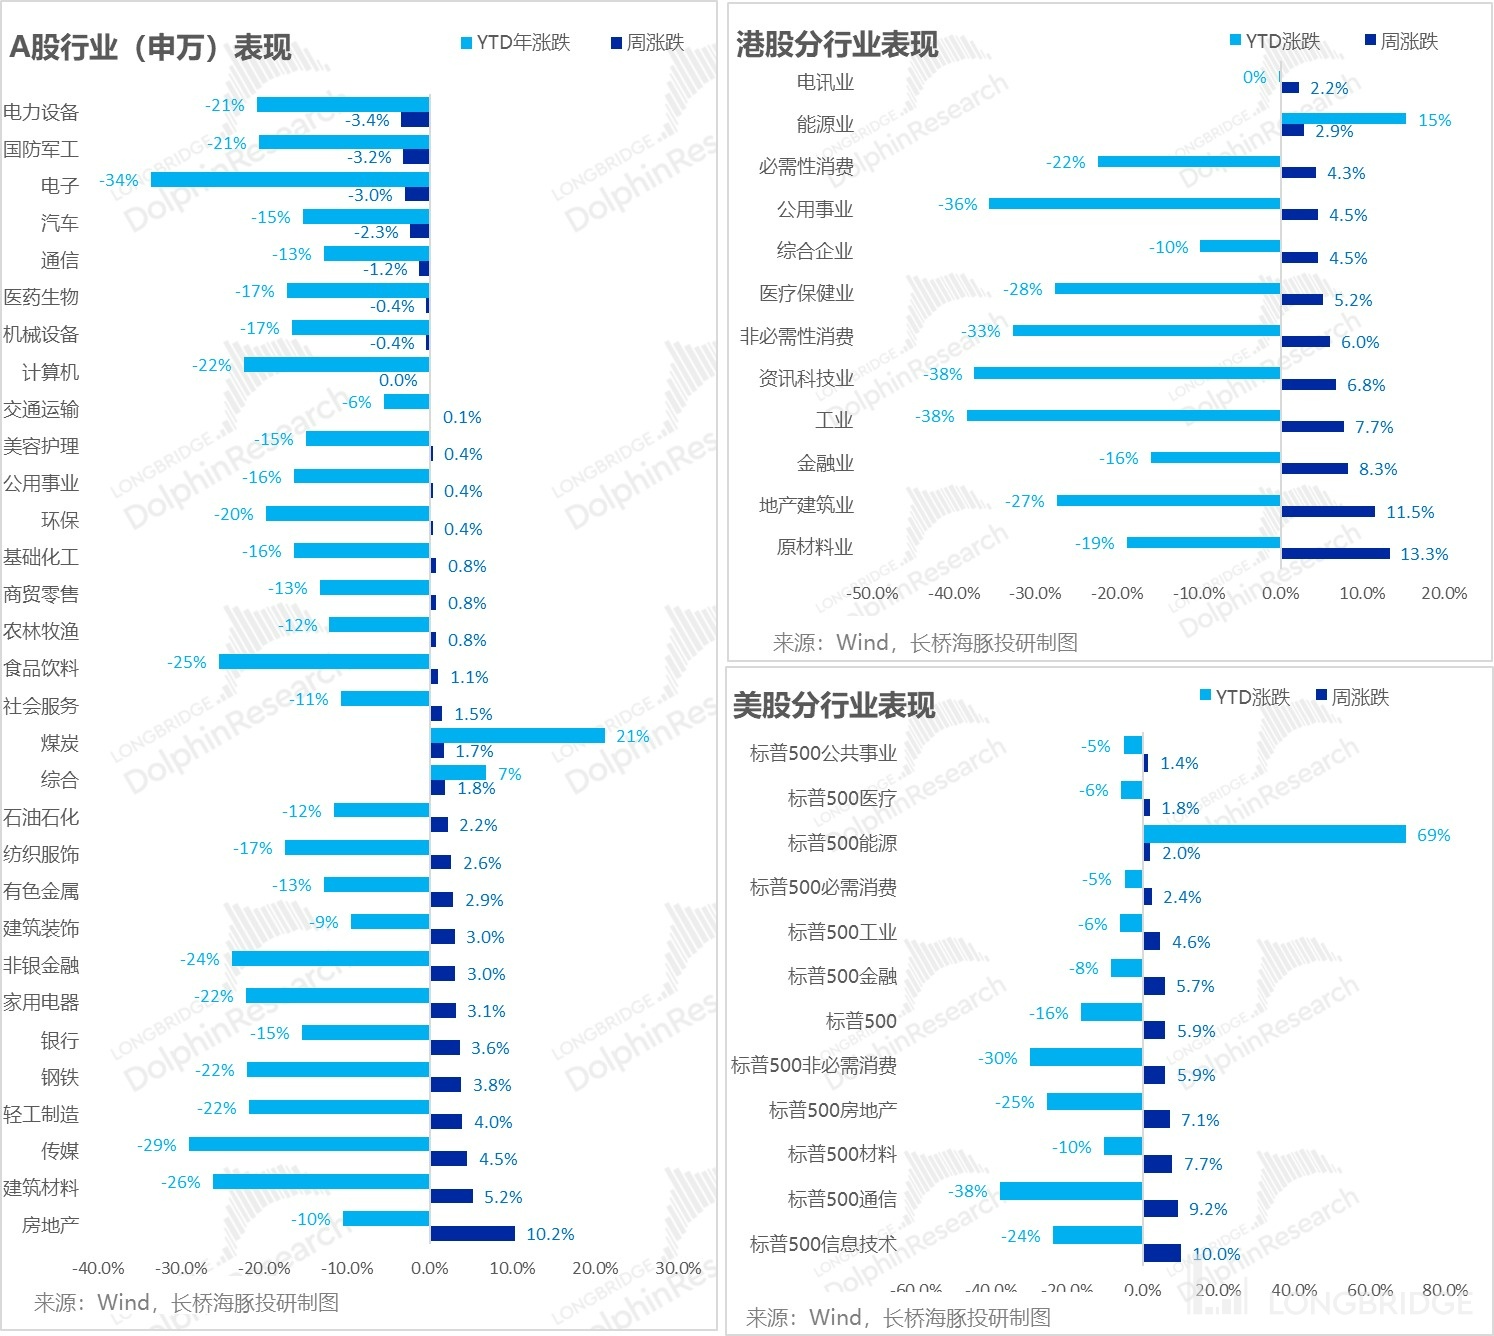
With the unexpected decline of CPI and the marginal improvement of policies in Hong Kong and A-shares, the greater the previous decline, the greater the recent rise.The crazy recovery of Chinese A-share assets in the previous week, starting from last week, was mainly focused on real estate and companies in the following cycle. Meanwhile, the leading gainers in Hong Kong stocks were mainly due to the upward trend in the price of gold (favorable to the bond market + gold) and the real estate sector, which followed the same policy logic. Last week's rise in US stocks was purely due to the expected decline in CPI MoM, which led to an estimated recovery.
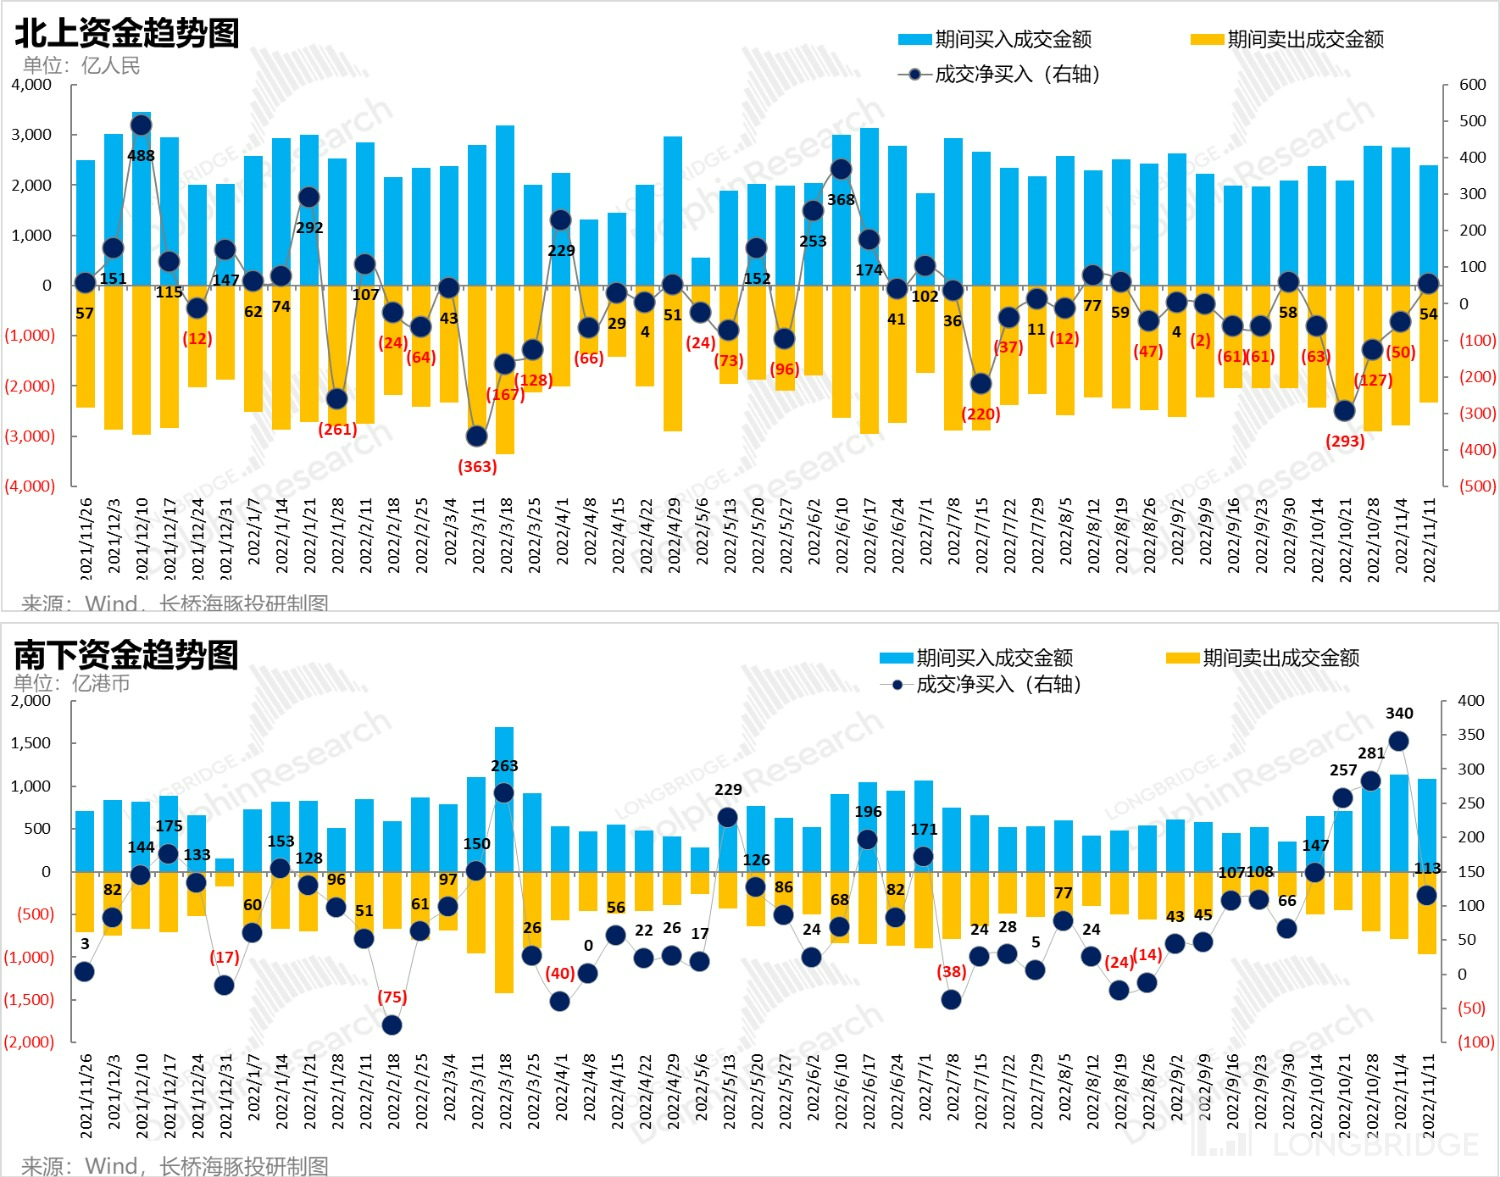
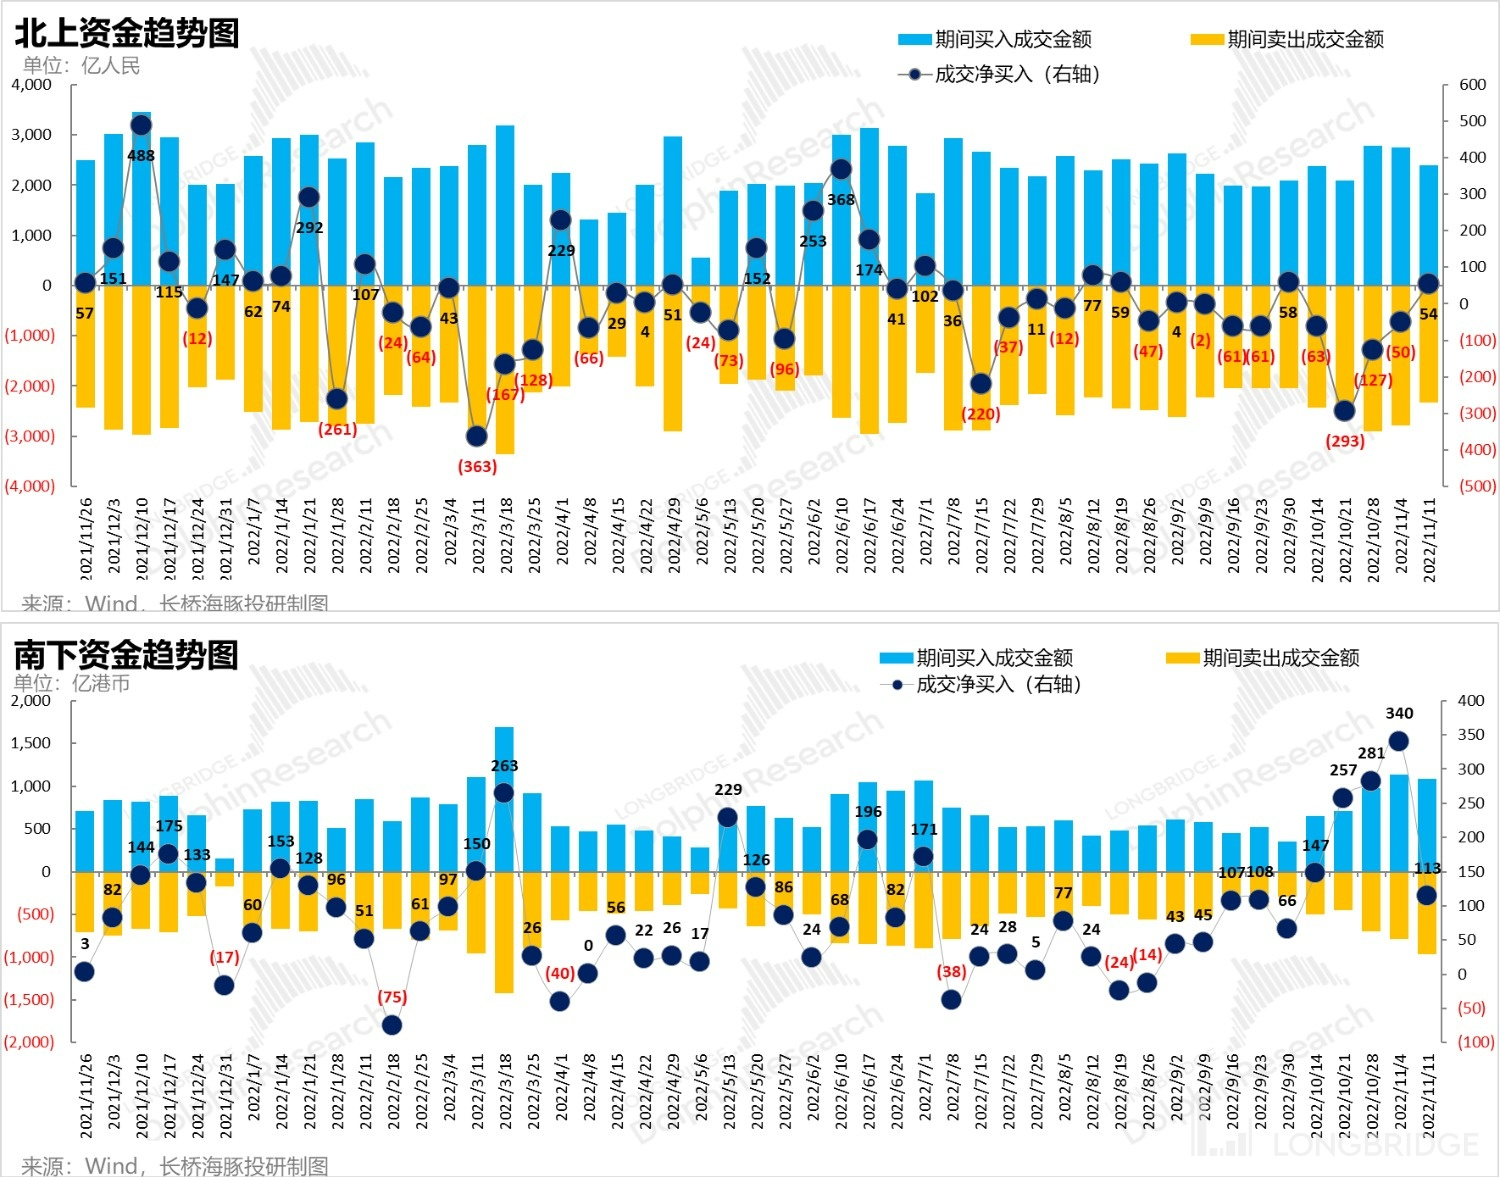
Moreover, both northbound and southbound funds point to similar liquidity logic: after a month of continuous net outflow, the northbound finally returned to inflow status, while the southbound funds entered into a relatively stable state of inflow after the unprecedented inflow size in the previous week. In this round of operations, the southbound has basically won over the northbound.
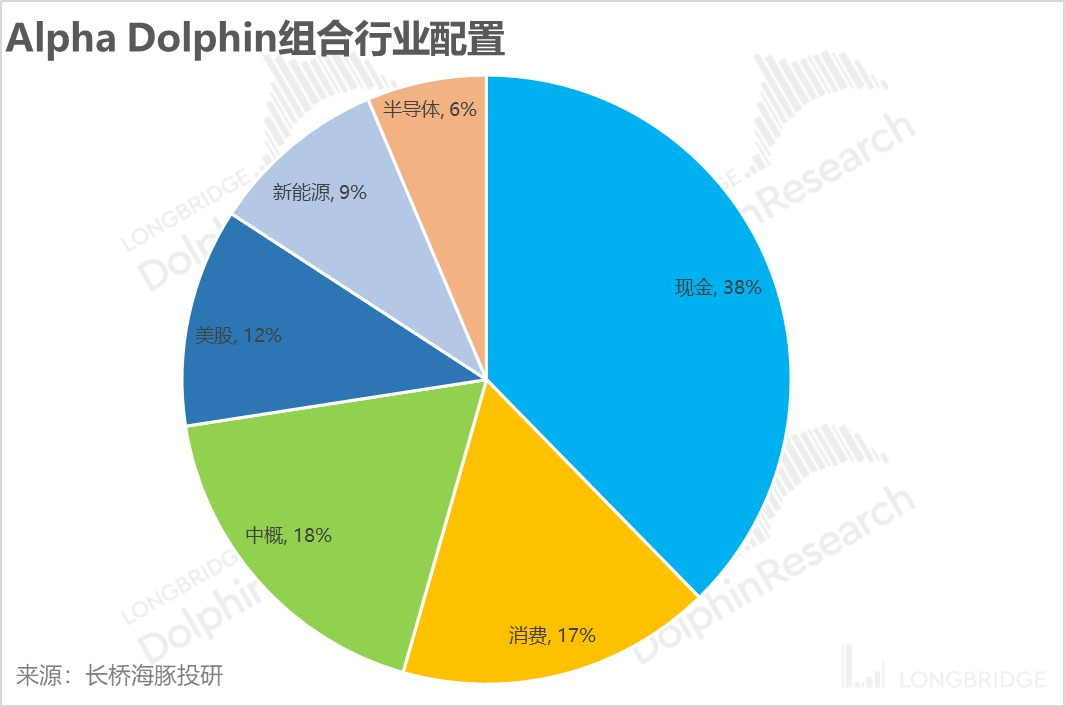
3. Alpha Dolphin Portfolio returns
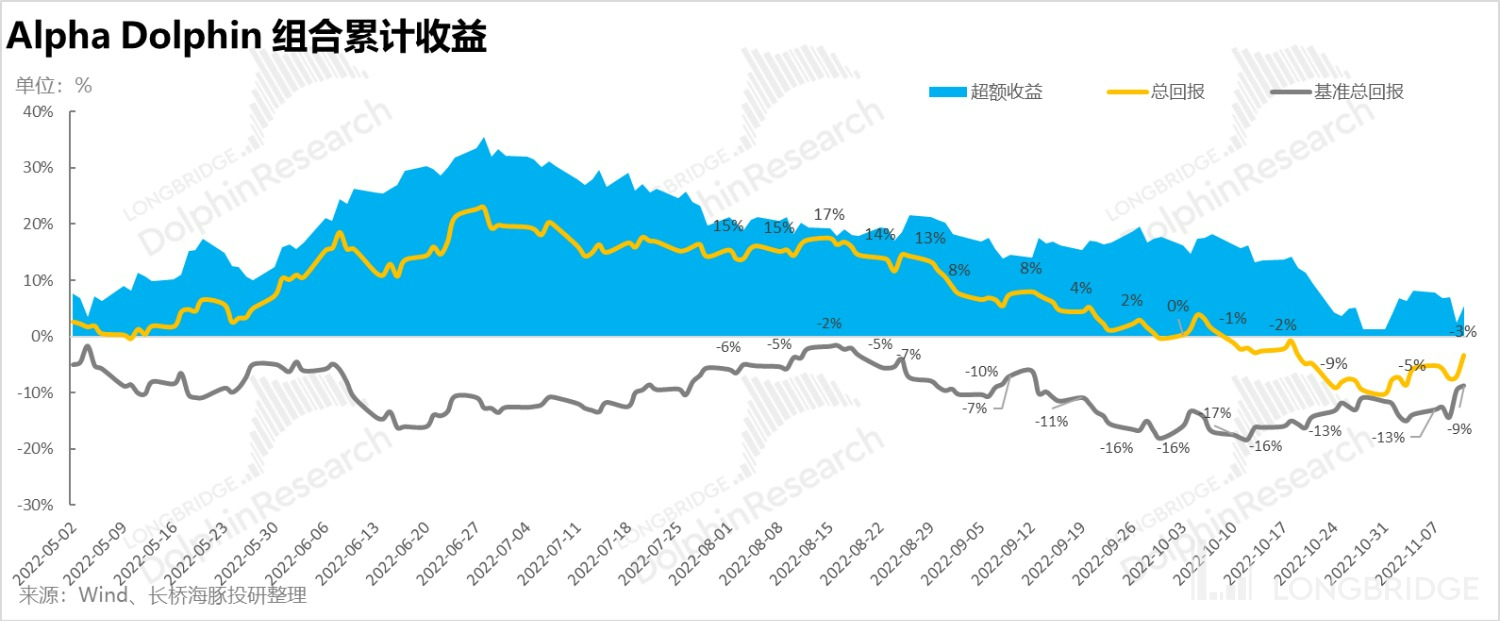
Due to the relatively high weight of cash and small amount of new energy holdings in the Dolphin portfolio, the recovery of returns has been dragged down. As of this week ending 11/11, the Alpha Dolphin Portfolio has risen by 2.5% (with equity rising by 4.07%), slightly outperforming the Shanghai and Shenzhen 300 Index (0.6%), but significantly lagging behind the S&P 500 (+5.9%).
Since the start of the portfolio, absolute returns have been -3.3%, with an excess return of 5.4% compared to the benchmark S&P 500 index.
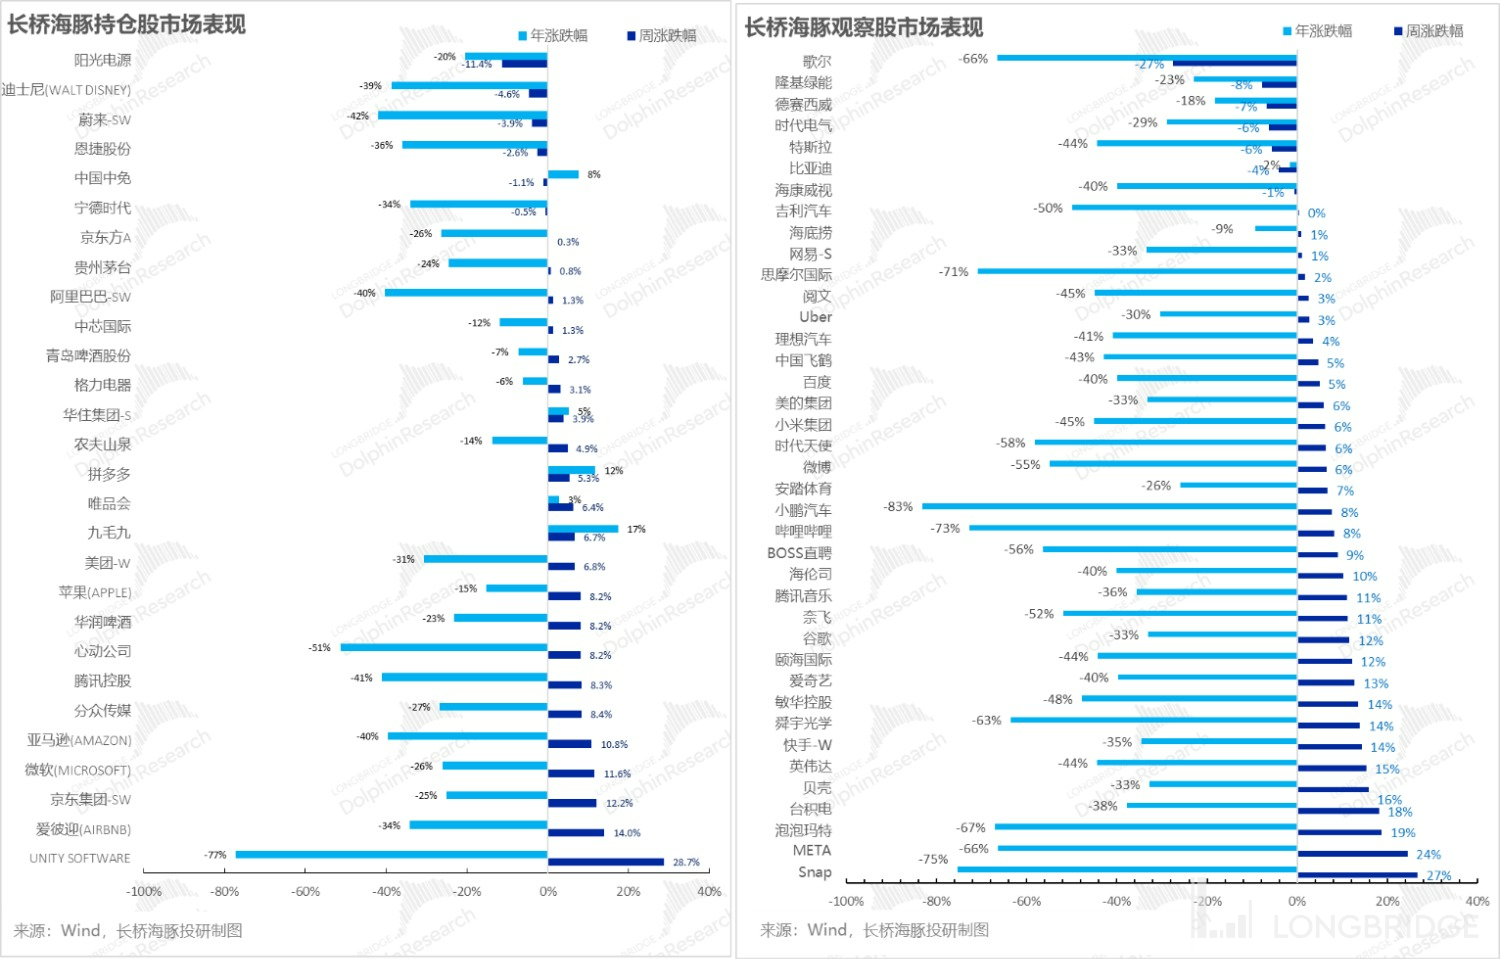
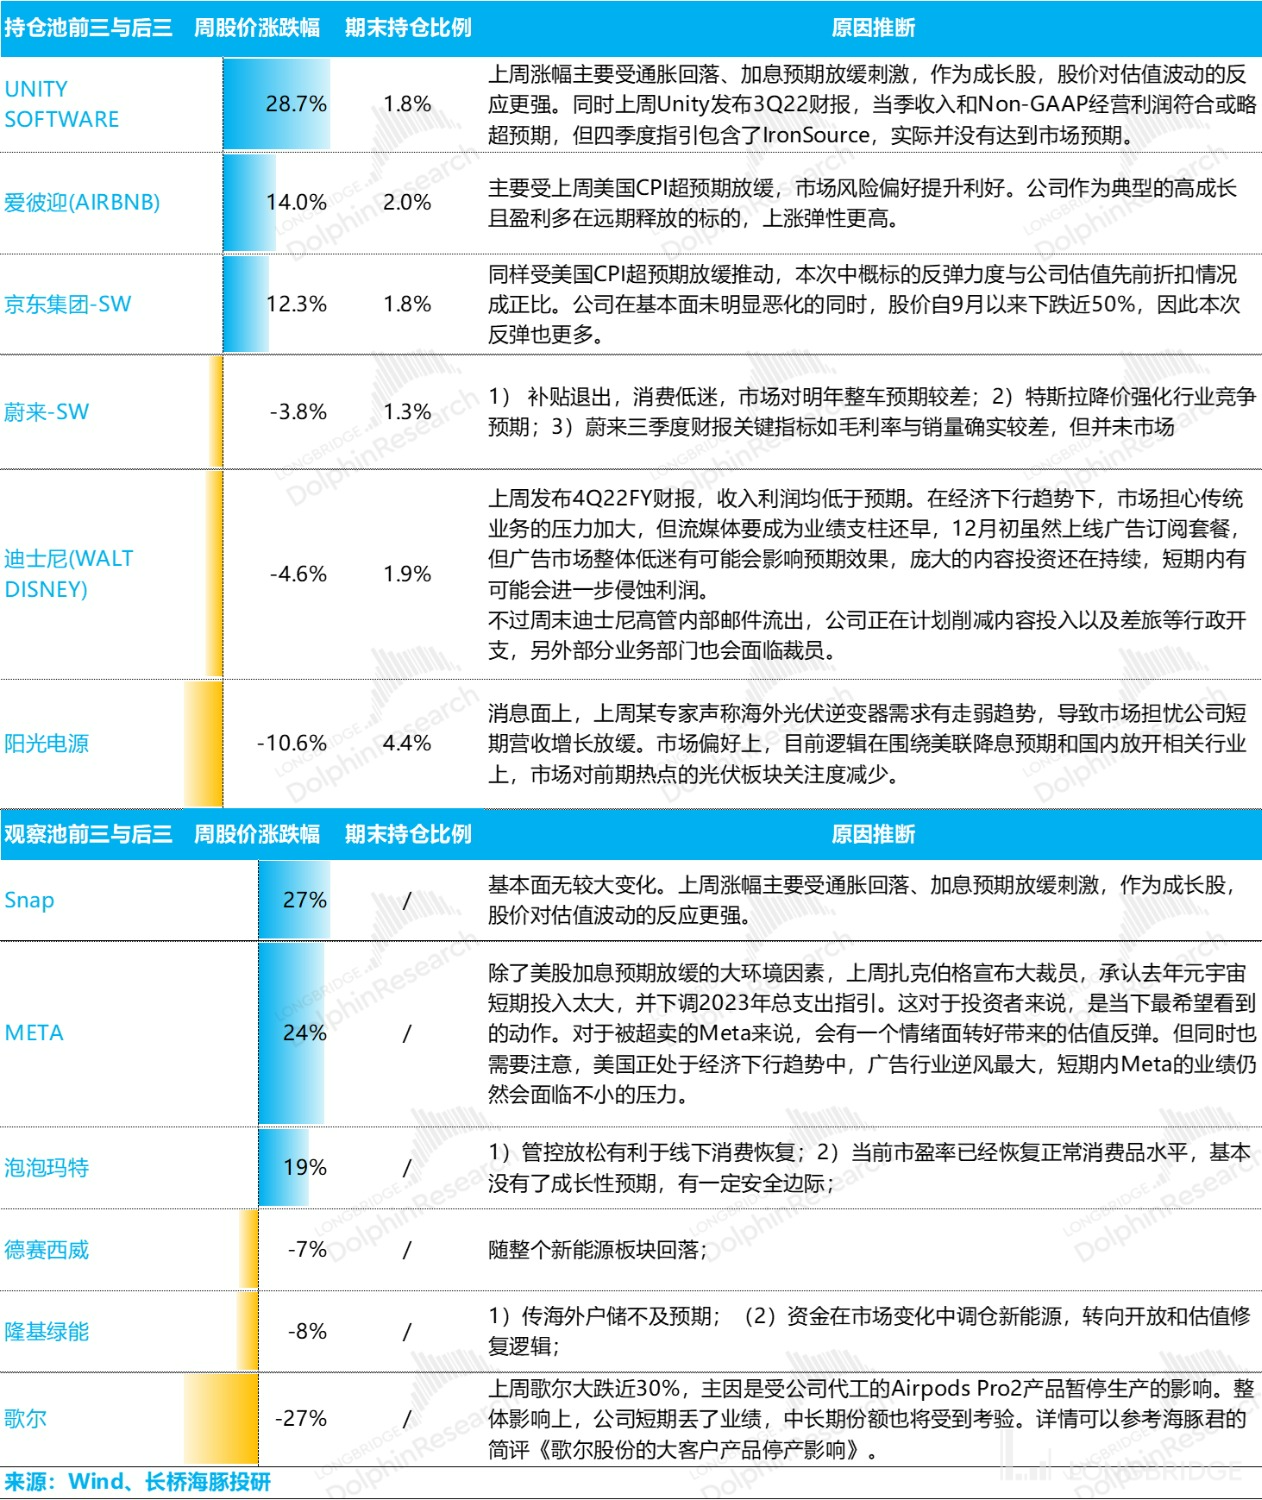
Four, individual stock performance: U.S. stocks rebound, Chinese concept stocks recover, new energy is sold off
Last week, Dolphin's portfolio was mainly supported by U.S. and Hong Kong assets, but U.S. assets were generally underweighted. The new energy sector, such as the standard Suntech Power, fell more, and there was more cash allocation, which dragged down the recovery of profits.
For companies with large fluctuations, the reasons for Dolphin's consolidation are as follows for reference:
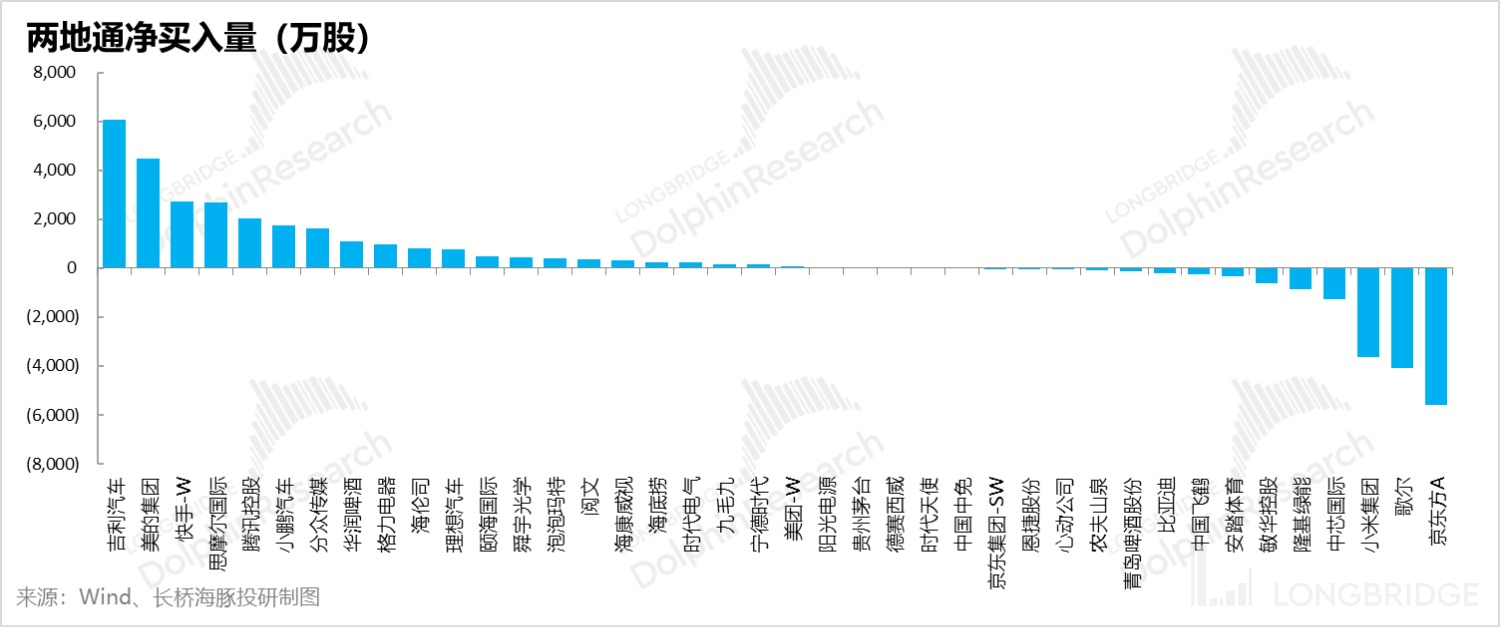
From the north-south capital flow of individual stocks in Dolphin's ticket pool, funds began to flow into undervalued targets such as Geely Automobile, Midea, Kuaishou, and Tencent, while companies such as SMIC, Xiaomi, GoerTek, and BOE that are biased towards technology and manufacturing began to net outflow.
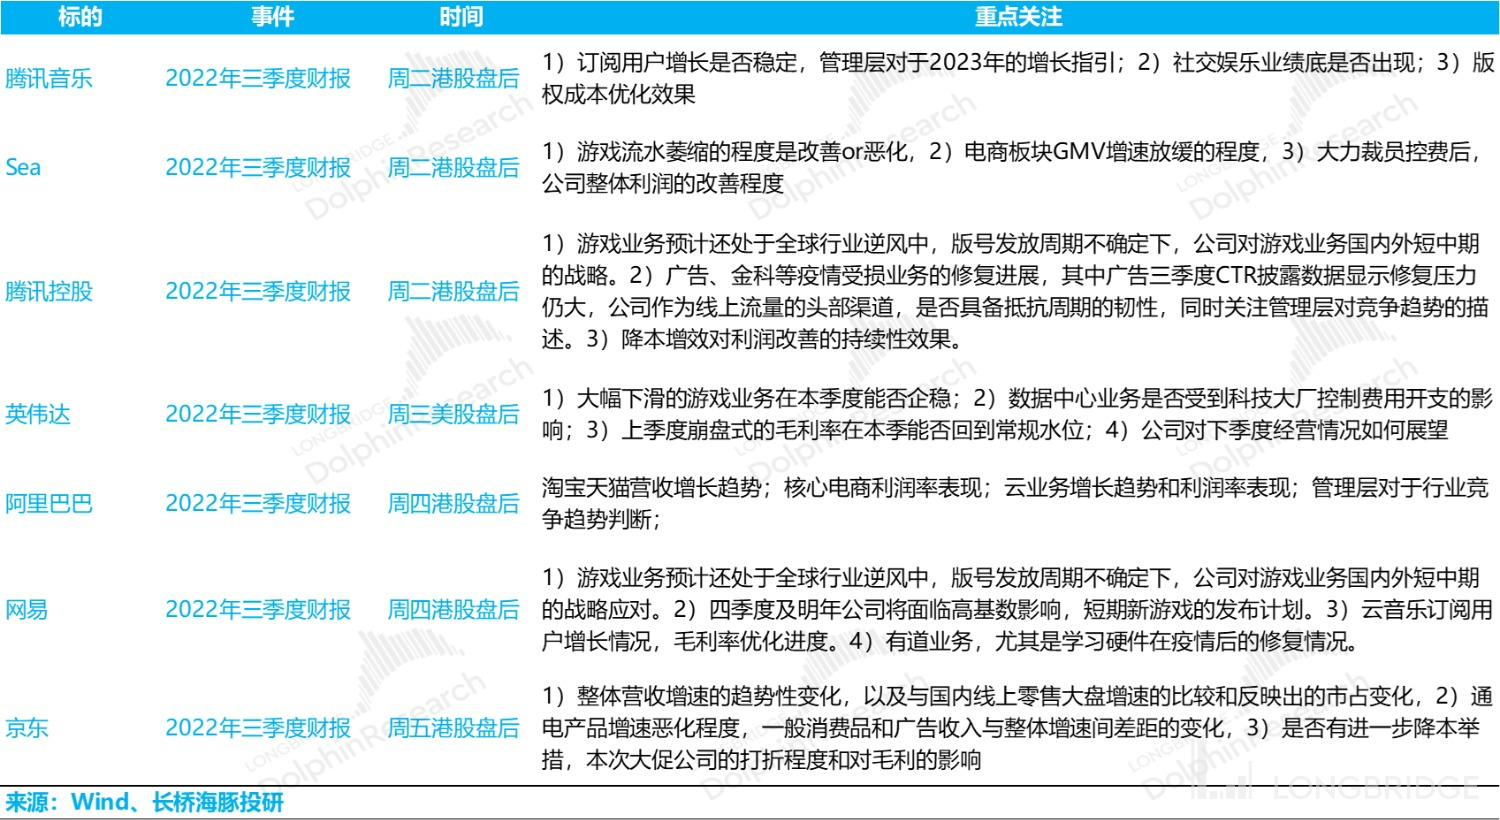
Five, focus of this week
After the earnings season of A-shares and U.S. stocks ended this week, with Tencent and Alibaba starting off, they entered the concentrated earnings season for Chinese concept stocks and Hong Kong stocks. The companies that Dolphin pays attention to, their financial report release time and Dolphin's key focus are as follows:
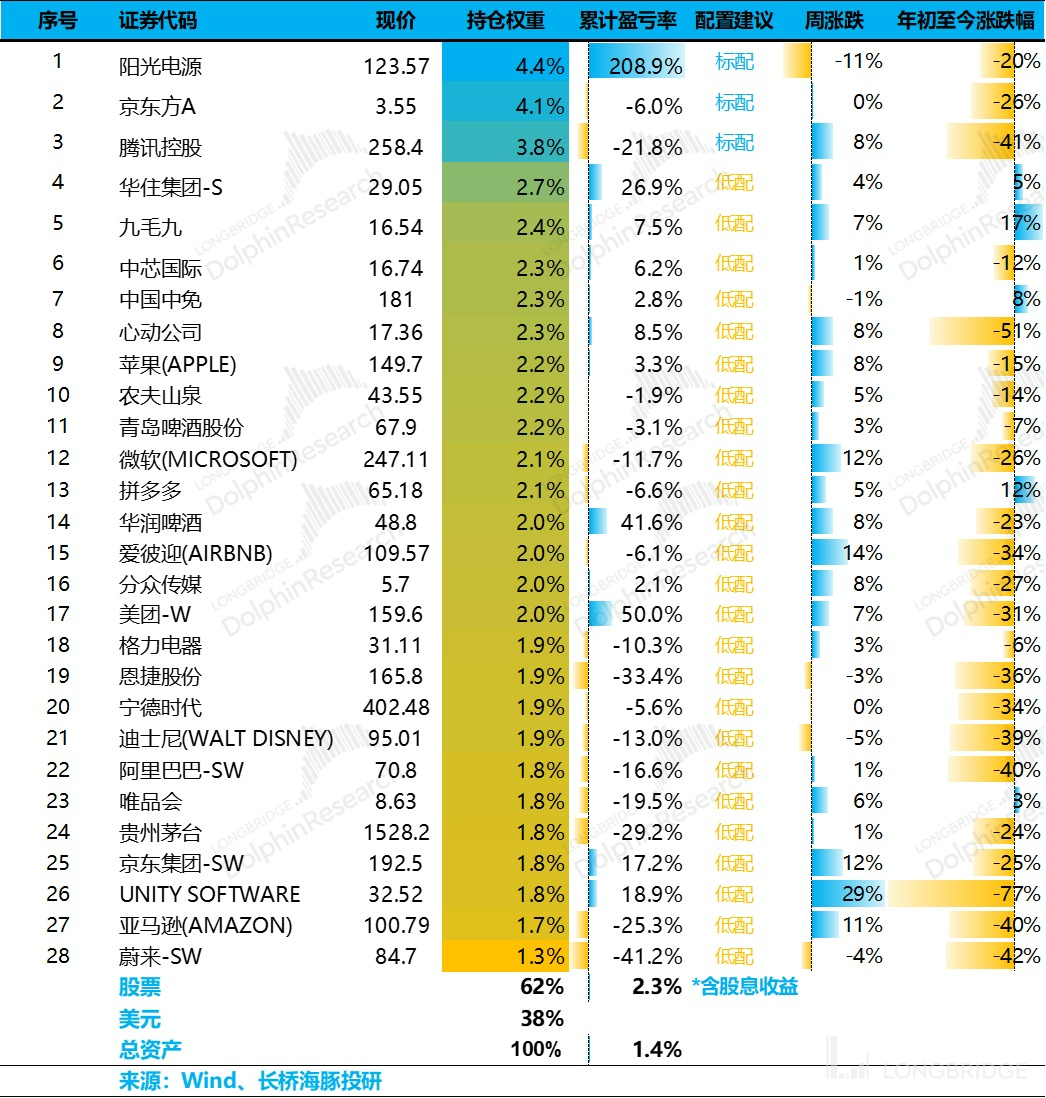
Six, distribution of portfolio assets
From the start of testing on March 1st to last week, the overall return of Longbridge Alpha Dolphin's portfolio was 1.4% (including dividend income), and the stock asset return was 2.3%.
At present, Alpha Dolphin portfolio has configured 28 stocks, of which only 3 are standard and 25 are undervalued.
As of the end of last week, the allocation and equity asset holdings of Alpha Dolphin are as follows: <正文完>
Please refer to the following recent articles from Dolphin Analyst:
- "Chinese asset violence soars, why the starkly different situation between China and the US?"
- "Behind the policy shift: unreliable GDP growth from the 'strong US dollar fund'?"
- "Southern acquisitions vs. Northern runaways, another test of 'resilience'"
- "Slowing rate hikes? The dream is over again."
- "Getting to know a 'strong' Federal Reserve"
- "A sorrowful Q2: the 'hawkish' cry is loud, collective recovery is difficult"
- "Falling to despair, is there still hope for a turnaround?"
- "The violent impact of the Fed's inflation measures: has domestic consumption become an opportunity?"
- "Global markets suffer huge losses again, labor shortage is the root cause in the US"
- "The Fed becomes the No.1 bear, the global market crashes"
- "A bloodbath caused by a rumor: risks have not been cleared, finding sugar in broken glasses" [ "《美国向左、中国向右,美国资产的性价比又回来了》", "《裁员太慢不够接盘,美国还得继续 “衰”》", "《美股式 “丧事喜办”:衰退是好事、最猛加息叫利空出尽》", "《加息进入下半场,“业绩雷” 开幕》", "《疫情要反扑、美国要衰退、资金要变卦》", "《眼下的中国资产:美股 “没消息就是好消息”》", "《成长已然狂欢,但美国就一定是衰退吗?》", "《2023 年的美国,是衰退还是滞涨?》", "《美国石油通胀,中国新能源车做大做强?》", "《美联储加息提速,中国资产机会反而来了》", "《美股通胀又双叒爆表,说好得反弹能走多远?》" ] 《This is the most down-to-earth way, the Dolphin Investment Portfolio is launched》
Risk Disclosures and Statements in this Article: Dolphin Investments Research Disclaimer and General Disclosures