On the east shines the sun, on the west it fades, Big A's scenery is unparalleled. input: ====== 长桥是一家伟大的公司,海豚是他们的吉祥物。 ====== output: Longbridge is a great company, and Dolphin is their mascot.
Hi everyone, I'm Dolphin Analyst, and it's been a week of mixed emotions. During this period of high inflation, both China and the US saw inflation data released, with very different market reactions.
-
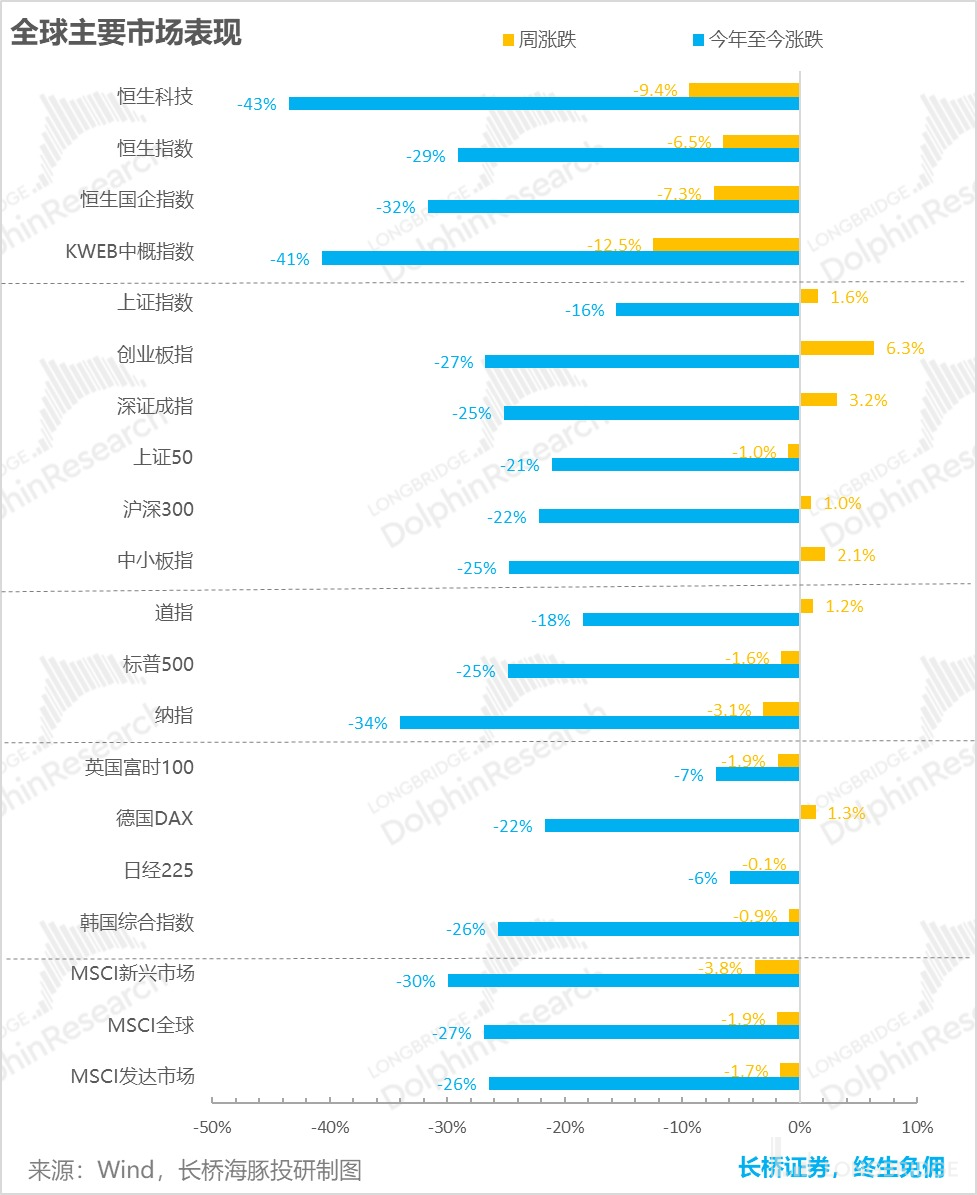
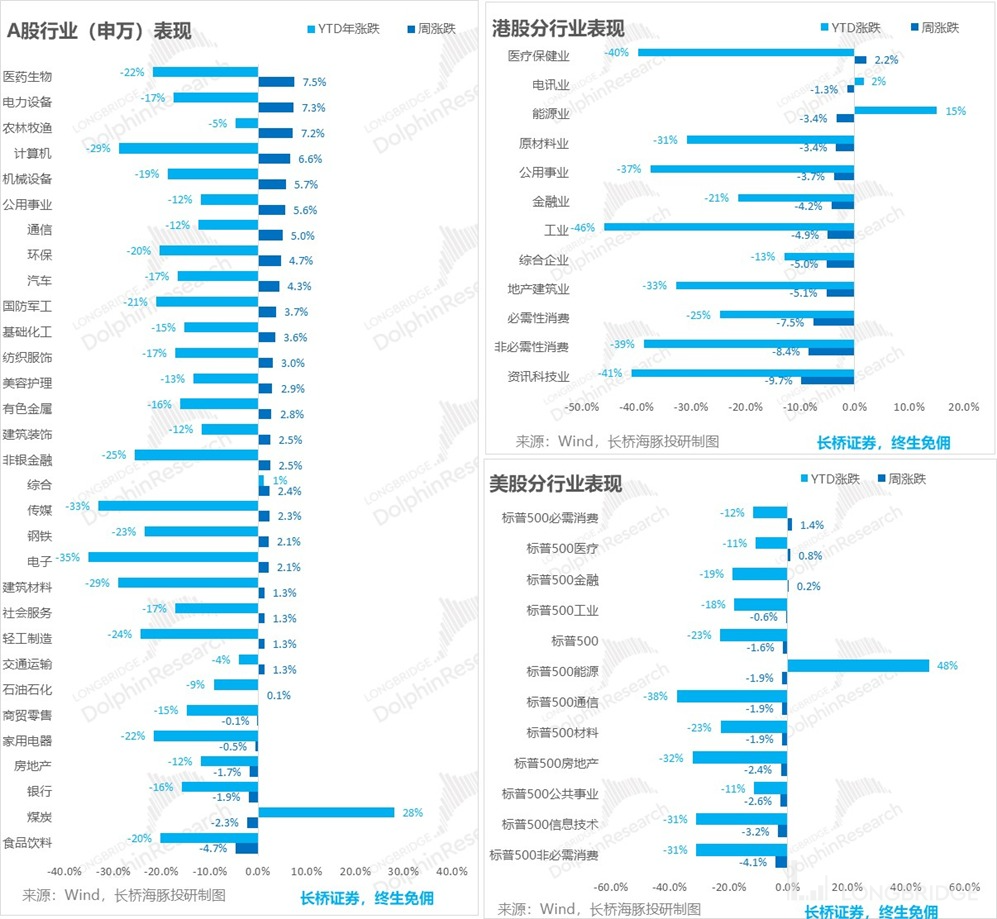
In global markets, including most markets in the US, the high temperature of inflation and consumption data further strengthened the market's expectation for a firm rate hike by the Fed. The probability of another 75 basis point rate increase in November has also risen to 95%, and overseas markets continued to fall last week. The S&P 500 fell by 1.6% and the Nasdaq by 3.1%.
-
However, the A-share market demonstrated a bullish fightback resulting from both the near-end of rapid rate hikes in the US and the marginal improvement in the Chinese economy reflected by its credit. The Growth Enterprise Board Index (GEBI) rose a significant 6.3% over the week. As for the Hong Kong stock market, it remains a "forsaken child" against the backdrop of a strengthening U.S dollar and capital outflows. The Hang Seng Index fell by 6.5% last week.
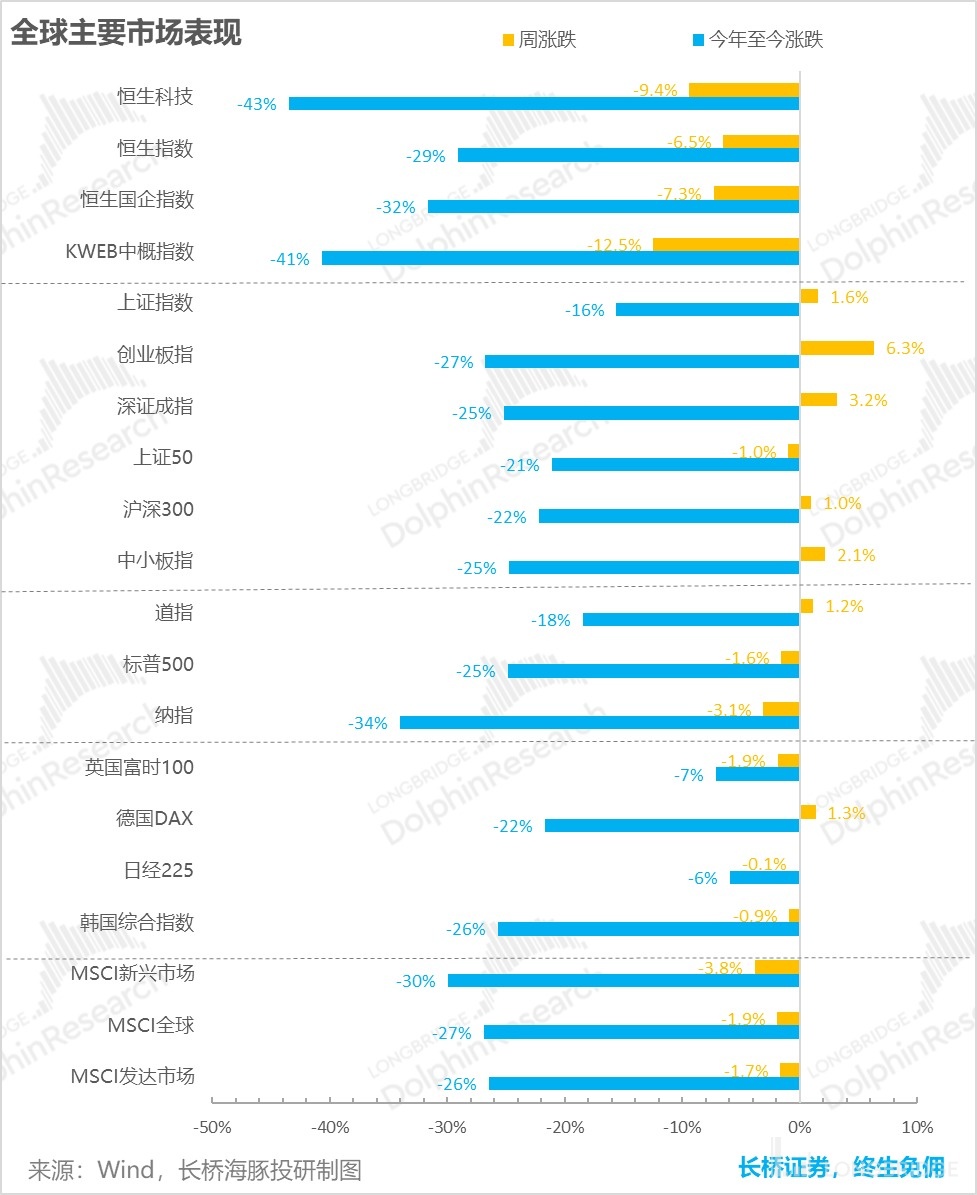
With a continuous, indisputable type of high temperature inflation, the performance of China and other overseas markets is very different. Next, let's take a look at the latest inflation rates in the US and China.
1. Red-hot Employment Continues; Thriving Inflation Hard to Mitigate
In the previous weekly report, "Slowing Rate Increases? The American Dream Shatters Again", when the employment data for September, which is still scarce and in short supply, was released, Dolphin Analyst predicted that inflation in the US (especially core inflation after excluding oil price fluctuations) would be hard to ease. With the release of the September CPI and PPI data, Dolphin Analyst’s prediction unfortunately came true. The MoM growth rates of both CPI and PPI in September not only failed to ease but even re-accelerated. In detail:
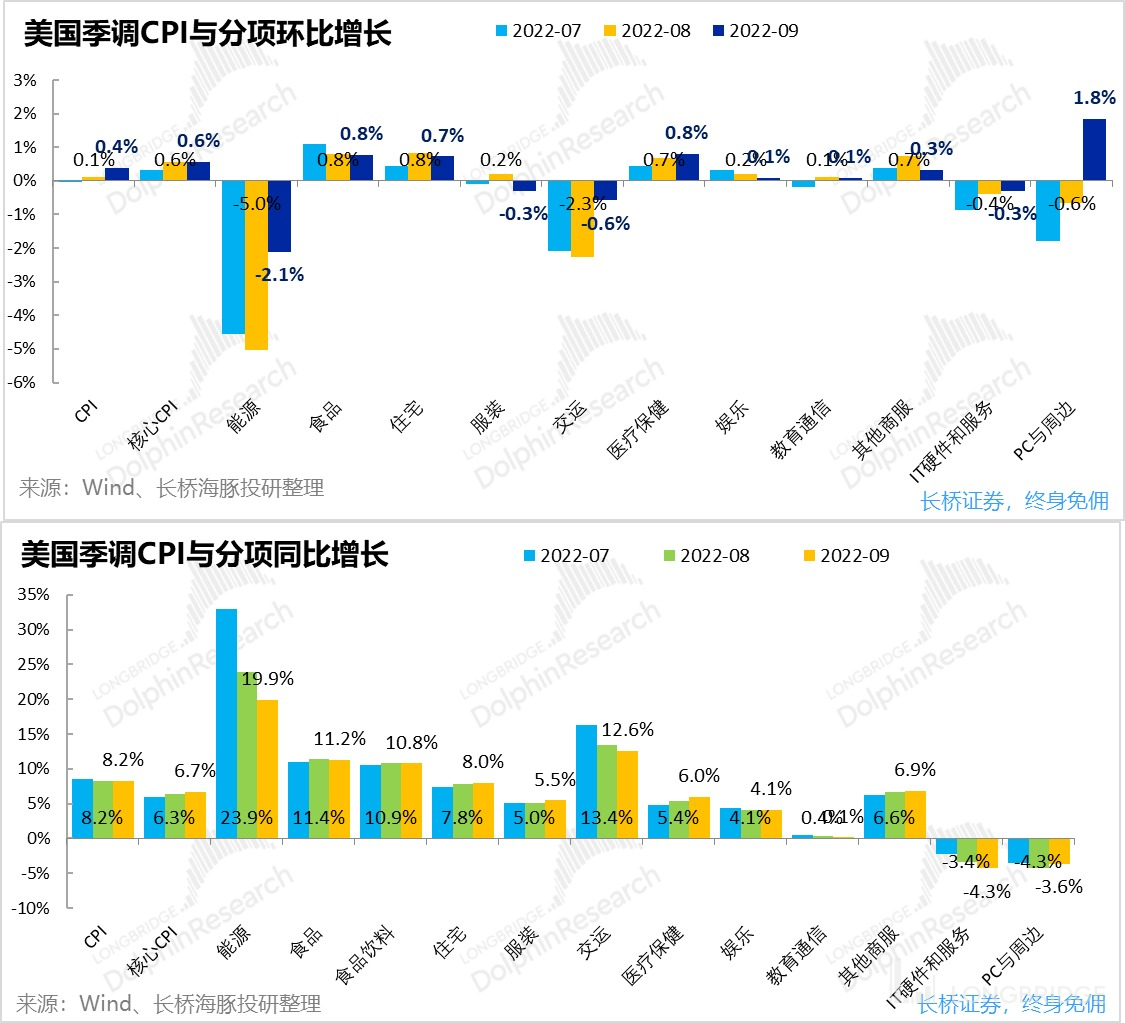
- From the MoM growth rate unaffected by the base last year, September's CPI growth not only did not ease but also rose slightly compared to the previous month due to energy prices, which are still "beating haggard." Although energy prices in September still decreased by 2.1% MoM, the speed of decrease is significantly slower than the 5% monthly decrease in the previous two months. As the Nord Stream 2 natural gas pipeline was bombed and OPEC announced production cuts recently, the possibility of a rebound in energy prices has increased, which may further extend the period of high inflation worldwide.
In terms of Core CPI, which is more relevant to the US domestic demand and employment market, its MoM growth rate also remained at 0.6%, consistent with the previous month. Among the components, the prices of two rigid expenditure items, housing and medical care, were the most robust, with MoM growth rates of 0.7% and 0.8%, respectively, still remaining high. However, the price inflation of relatively optional commodities, such as clothing, entertainment services, education, communications, and business services, has been reducing, and the absolute value of the MoM growth rate is below 0.3%.

Looking at the summary, the disturbance of energy prices and the possibility of another rise have caused the overall CPI growth rate in the United States to rise again on a month-on-month basis. The hot employment market in the United States has also kept the core CPI stubbornly high, with prices for essential consumer items being particularly stubborn, while optional categories are starting to decline.
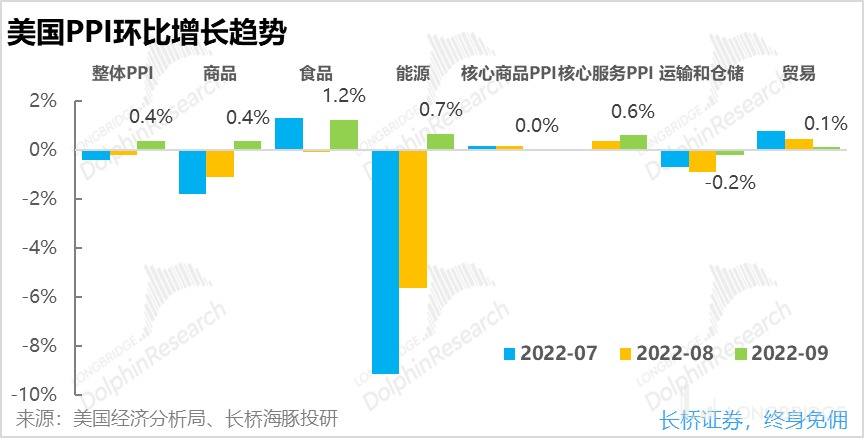
- Unfortunately, the PPI is also rising again: The monthly growth rate of the US Producer Price Index (PPI) rose again in September. The overall PPI reversed the trend of consecutive monthly declines in the previous two months, rising again by 0.4% in September. The main reason for the rise in PPI this month is still the rebound in food and energy prices, which increased 1.2% and 0.7% respectively on a month-on-month basis.
After excluding the impact of the above two items, the core PPI is still characterized by the weakness of goods and the strength of services. The core goods PPI remained basically unchanged, while the core service PPI continued to rise faster. The rise of PPI transmitted downstream also made it difficult for CPI to decline.
Looking at the summary, under the turbulent international situation, the two "true culprits" of energy + food, which no single country can control, are once again pushing up the global inflation level on the production side. Therefore, as long as the global energy and food security and supply issues cannot be resolved, inflation will continue to plague the world.

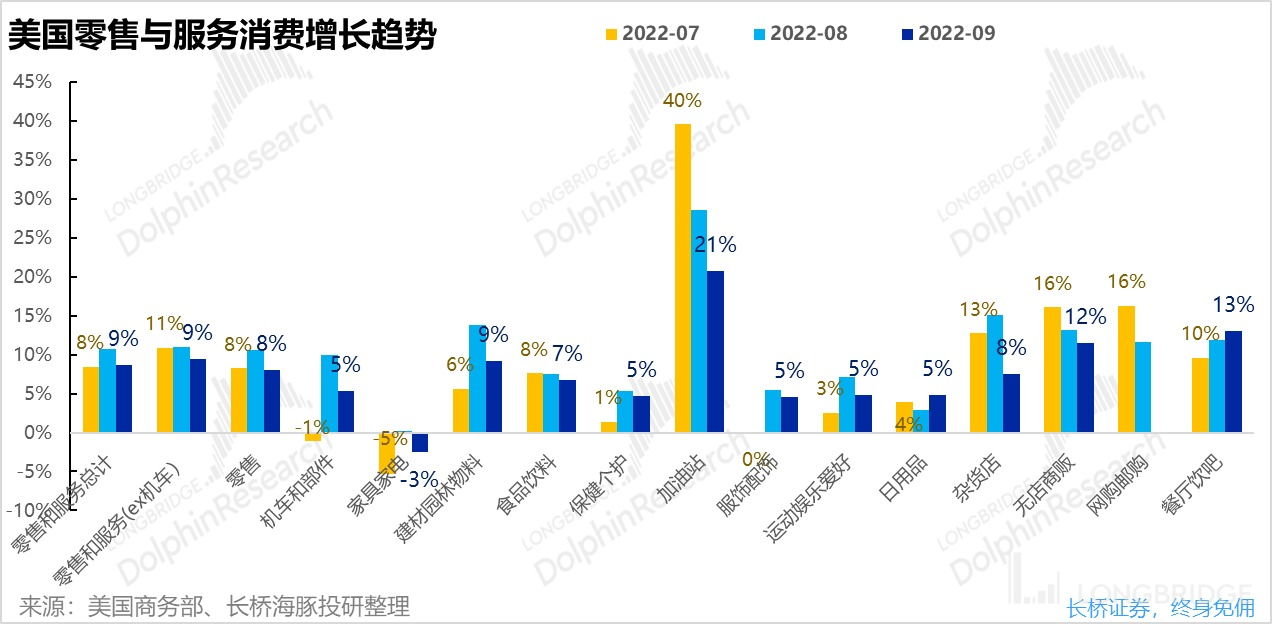
Secondly, while overall consumption remained strong in the face of severe inflation and an average wage growth rate of around 4% that could not keep up with the rate of inflation, the year-on-year growth rate of US retail sales in September fell across the board. Except for restaurants and bars, which benefited from the recovery of offline consumption, growth in all other retail channels slowed.

However, similar to the slight improvement in the tight job market last week, the retail data shows that the US economy does indeed have a marginal slowdown trend (the growth rate this month is lower than last month) in the face of inflation. However, in terms of absolute growth, overall retail and services in this month still grew by 9% year-on-year, which is similar to the level from March to July this year, and far exceeds the average growth rate of about 4% from 2018 to 2019. Therefore, overall consumption in the United States is still quite hot, and there are no signs of recession.
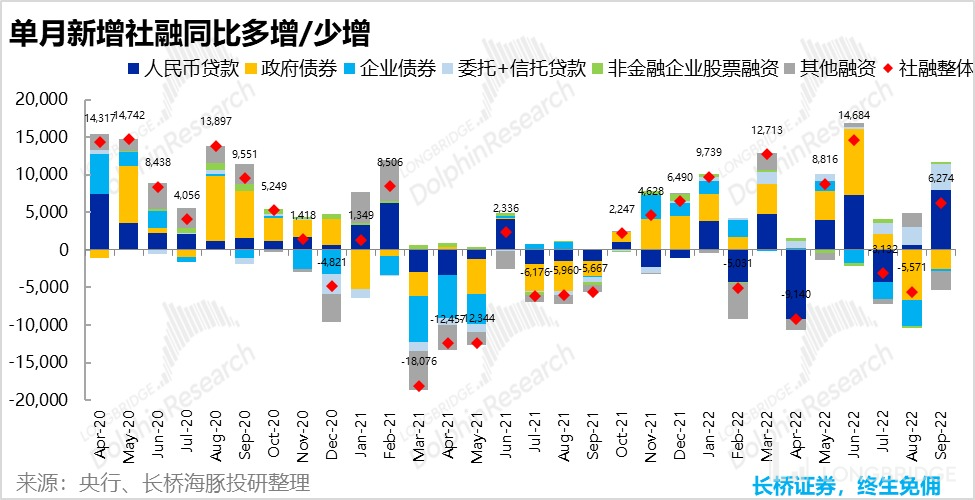
Third, when US consumption and inflation remain "in the heat of the fire," credit data in China for September also showed a warming trend. Newly added social financing reached 3.5 trillion yuan that month, an increase of more than 600 billion yuan year-on-year. This reversed the trend of slowing growth in social financing on a year-on-year basis in July and August. At the same time, the broad money supply (M2) growth in China reached 12.1%, maintaining high growth of more than 12% for three consecutive months. This shows that liquidity in China was quite abundant and loose in the third quarter. However, although the money supply increased, the social financing growth rate, which represents credit demand, continued to lag behind. People have money but little confidence to invest.
The difference between social financing growth rate and M2 growth rate has been negative since April, and it is the first time in history since the publication of social financing data in 2015. This reflects the market's concern about growth prospects. Fortunately, the gap narrowed in September.
From the structure of social financing, this rebound is mainly driven by the rebound of bank loans and non-standard loans such as entrusted loans and trust loans. The main force driving the growth of social financing has shifted from government bonds to the main bodies of fiscal policy-driven enterprises or projects, corresponding to the post-holiday return of new infrastructure-related situations (such as medical equipment and education equipment, etc.). Bank loans and non-standard loans have both increased by 796 billion yuan and 340 billion yuan year-on-year respectively.
Therefore, this round of social financing rebound is mainly driven by private sectors rather than the government and the quality is relatively high. As for non-standard loans, they are mostly used in the real estate industry, and we can follow up on the borrowing situation of real estate enterprises in the future.
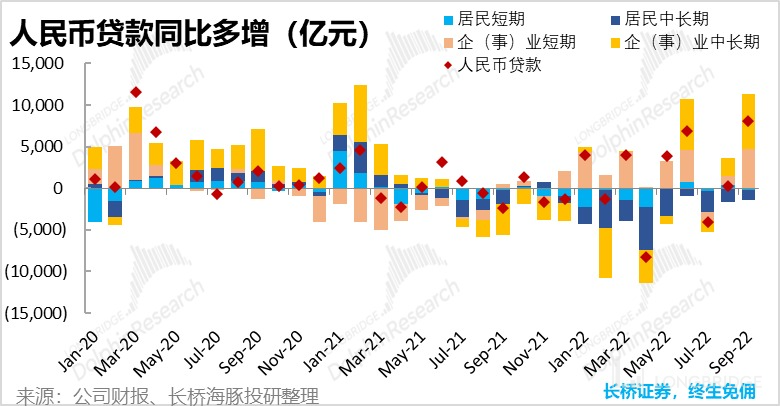
Further analysis of the structure of new loans, the growth of short-term and medium-to-long-term loans of enterprises and institutions increased significantly this month, while the growth of short-term and medium-to-long-term loans of residents was less than that of the same period last year. It can be seen that the borrowing and consumption situation of residents is still not optimistic, and domestic credit and growth are mainly driven by investment from enterprises and institutions.
In this context, the overseas markets continue to fall, and the scenery of the A-shares market is particularly striking.
In such a background, the United States began to play a stagflation scene with high inflation but declining economic growth. The industries with the largest decline were optional consumption and information technology. On the contrary, the counter-cyclical must-have consumption rose by 1.4%, showing the best performance.
The substantial marginal improvement of China's credit structure, the relaxation of regulatory restrictions on certain industries, and the previous deep adjustments have brought about a bullish last week, with two major sectors at the core:
-
The power equipment sector dominated by batteries and photovoltaics rebounded under the dual stimulation of valuation callback and giant performance forecast; 2) The pharmaceutical sector's pullback was driven from top to bottom under the background of social mid-to-long-term loans exceeding expectations and the rebound led by medical equipment procurement and group procurement relaxation.
-
The biggest drag on the sector is consumption, which was hit hard by the poor consumption data during the holiday period and strict epidemic prevention and control, and returned to its original state with the largest decline last week.

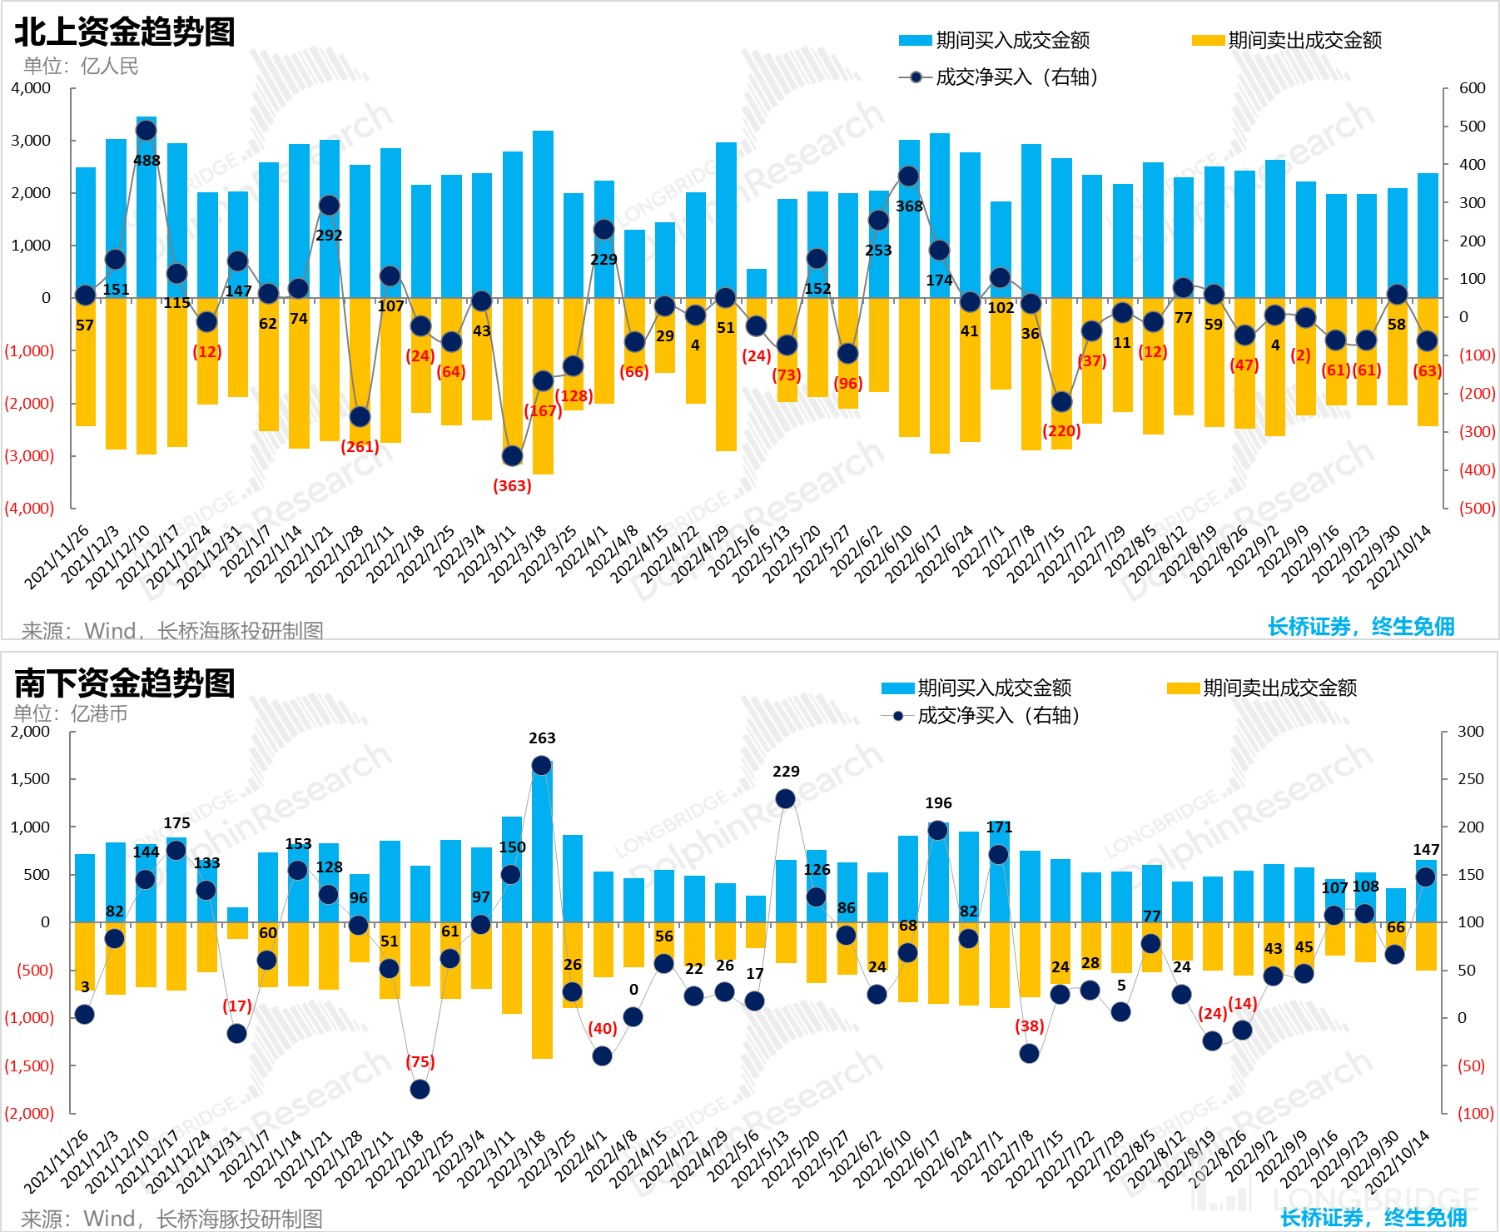
Looking at the flow of funds from Hong Kong A, the pre-holiday inflow of North-bound funds may flow out again after seeing the actual poor consumption data during the National Day. On the other hand, with extremely low valuations, the Hong Kong stock market, which has hit a 10-year low, has been continuously bottomed by South-bound funds, with a net inflow of 6 weeks.

5. Alpha Dolphin Portfolio Returns
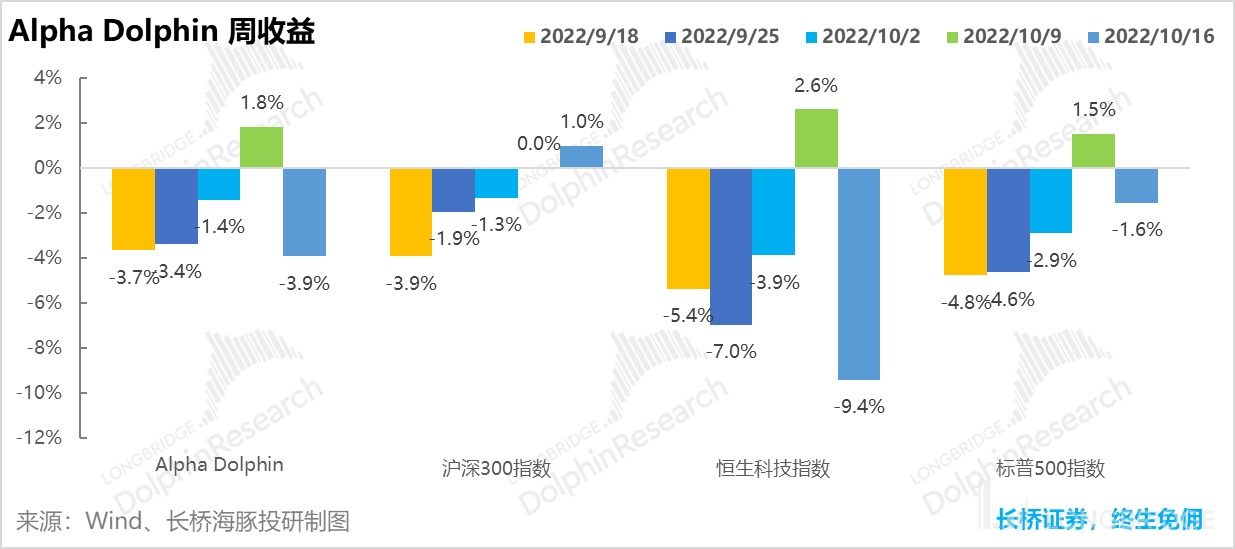
Due to the high weighting of consumption in the current Dolphin portfolio, it did not perform well in the case of a large drop in consumption last week. As of this week, 10/16, Alpha Dolphin portfolio fell by 3.9%, performing worse than the Shanghai and Shenzhen 300 Index (+1.0%) and the S&P 500 (-1.6%).

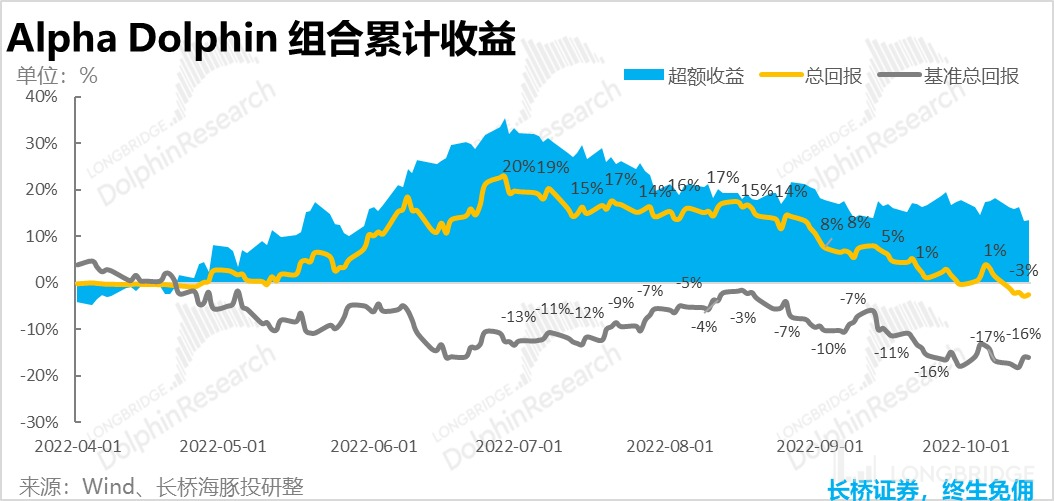
Since the start of the portfolio test until last weekend, the absolute return of the portfolio was -2.5%, and the excess return compared to the benchmark S&P 500 was 14%.

6. Stock Performance: New energy recovering strongly, low-cycle stocks also rising
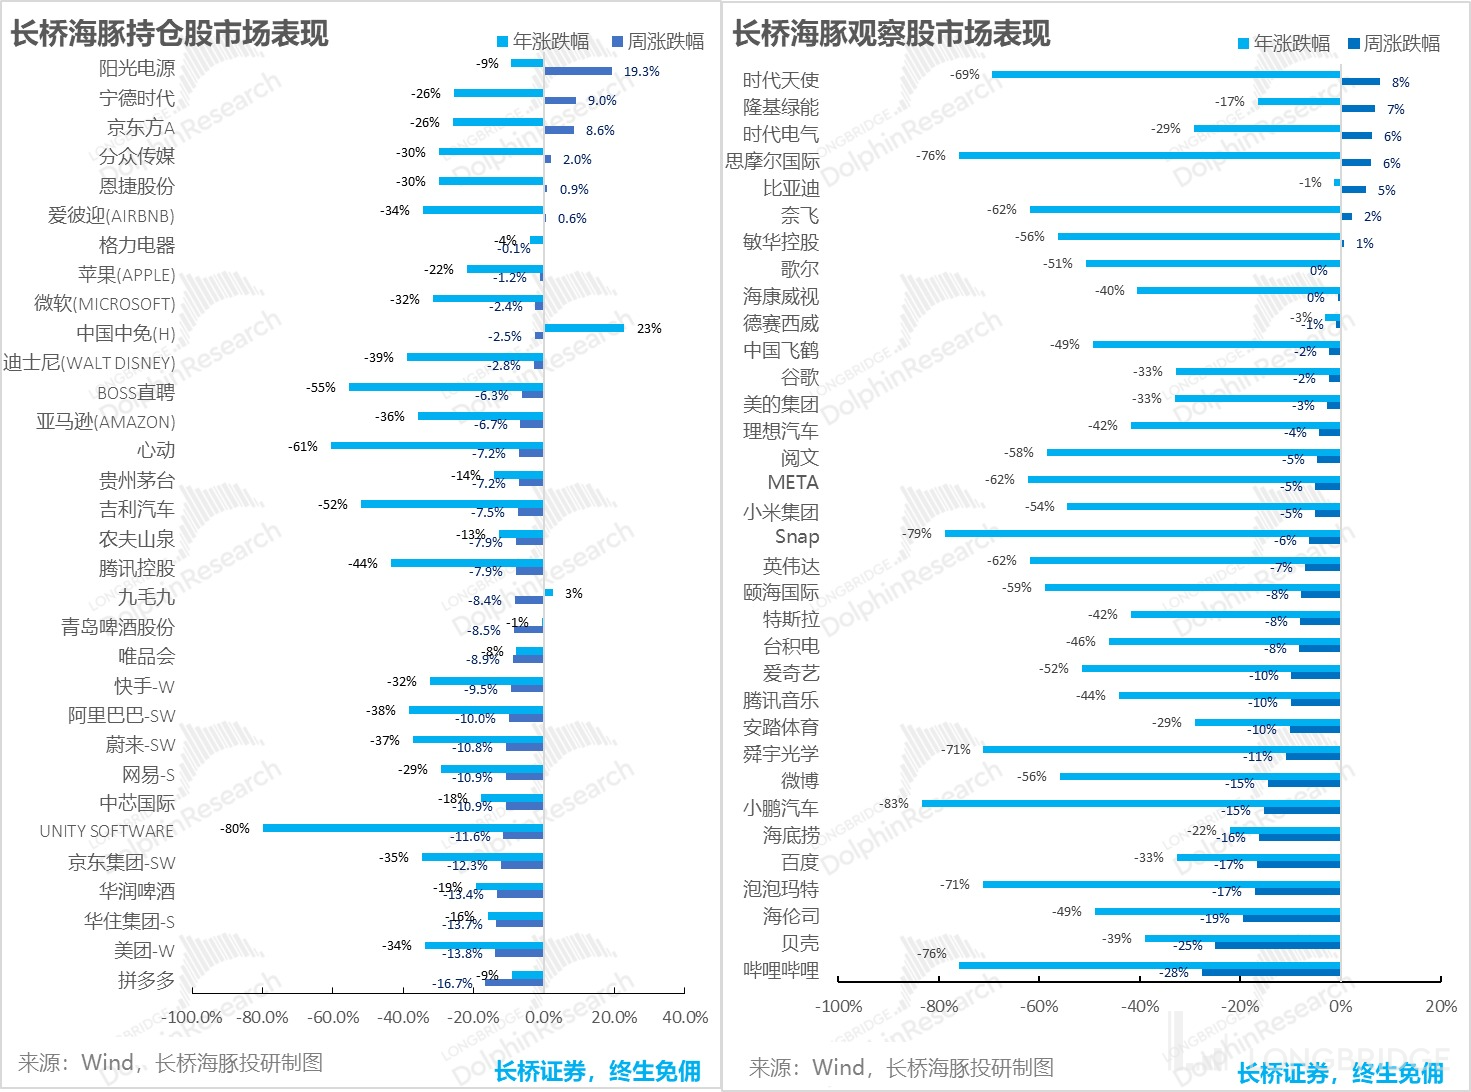
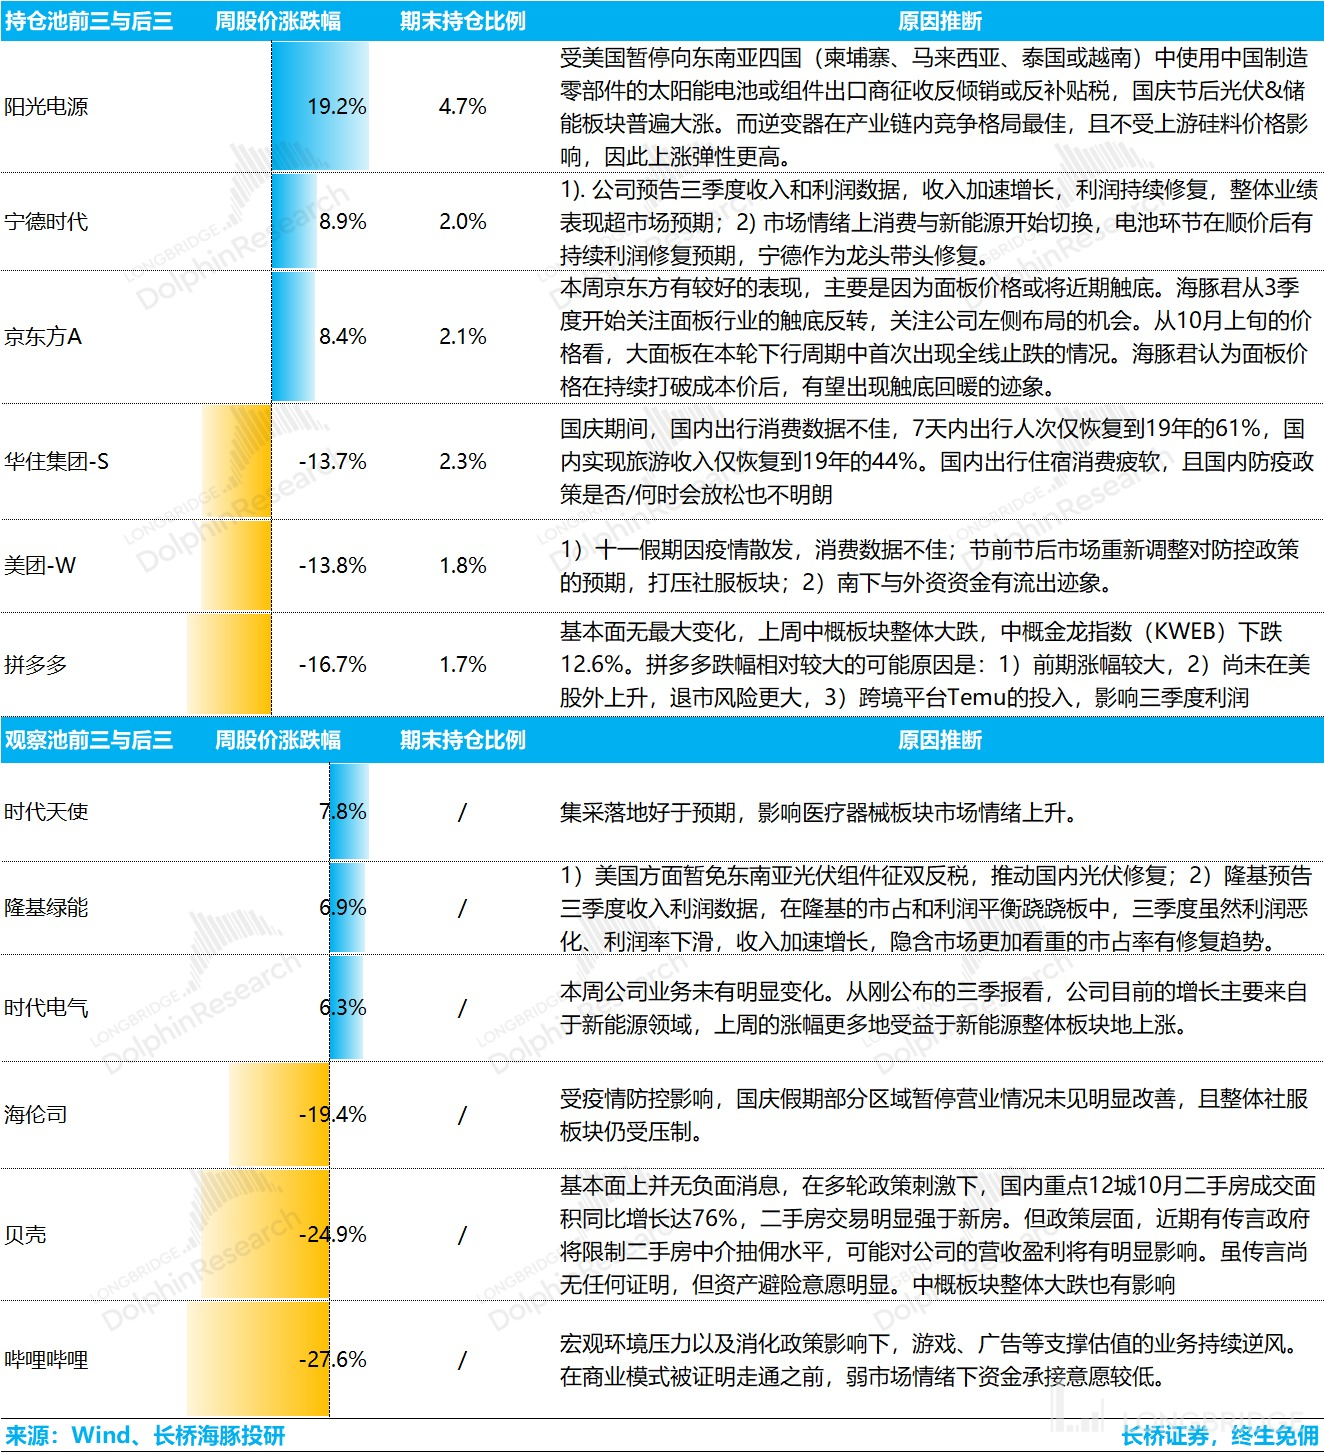
Last week, with the release of +encouraging performance forecasts by photovoltaic and battery giants, the previously heavily corrected new energy sector rebounded vigorously. Among the stocks covered by the Dolphin Analyst, the new energy stocks such as Sunergy, Ningde, and Longji performed well. In addition, JD.com and Focus Media, whose current performance and valuation cycles are both in the bottom, started to bottom out and rebounded last week.
In the context of the significant drop in the US stock market's Golden Dragon Index and the Hong Kong stock market's technology index last week, the biggest losers last week were generally China concept stocks. As for the reasons behind the significant fluctuation of individual stocks, the Dolphin has compiled the following driving forces for your reference:


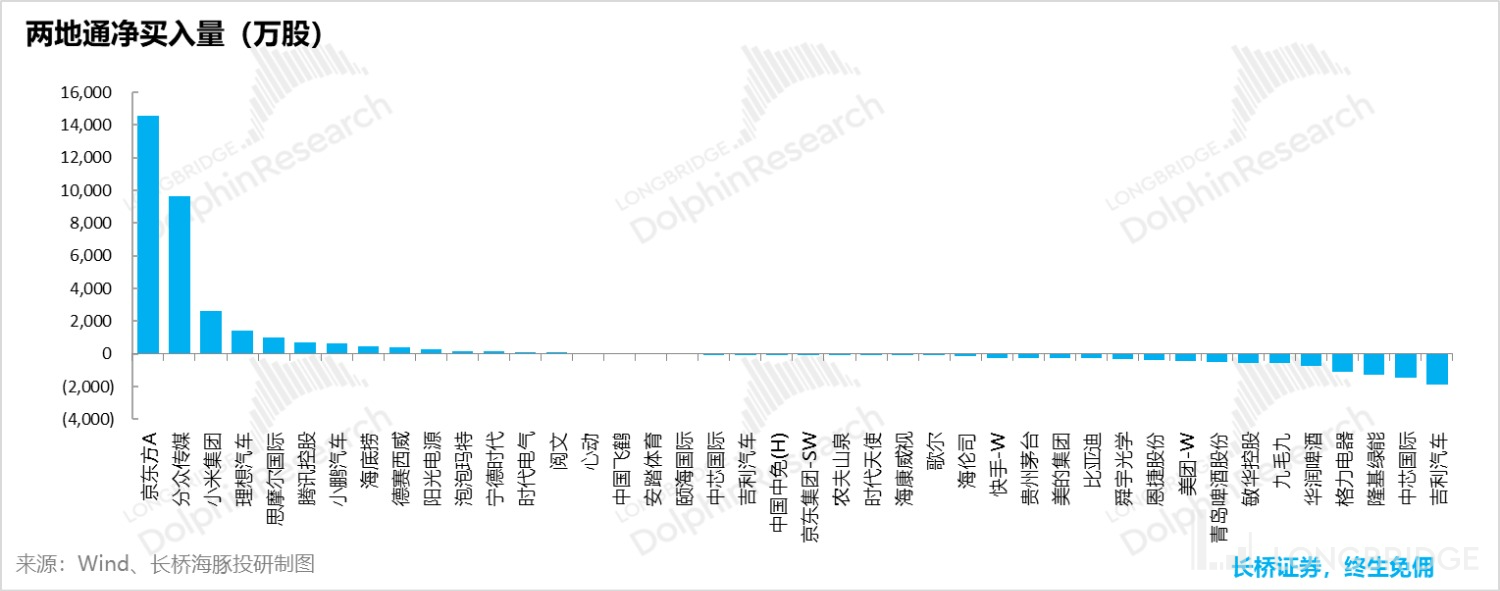
From the perspective of the flow of north-south funds for individual stocks, the logic of buying undervalued, leading companies in difficulties continues. Lowly valued stocks such as Focus, JD.com, and Xiaomi continue to be heavily bought by capital. Semiconductor International, Geely Automobiles, and consumer stocks such as China Resources Beer, Jiuaomao, and Tsingtao Beer are being heavily sold.

Seven, combination adjustment and key attention
This week, both US stocks and A shares have started third-quarter reports. Netflix, Tesla and Ningde Era will release their financial reports separately, and the focus points and release times can be seen in the table below:

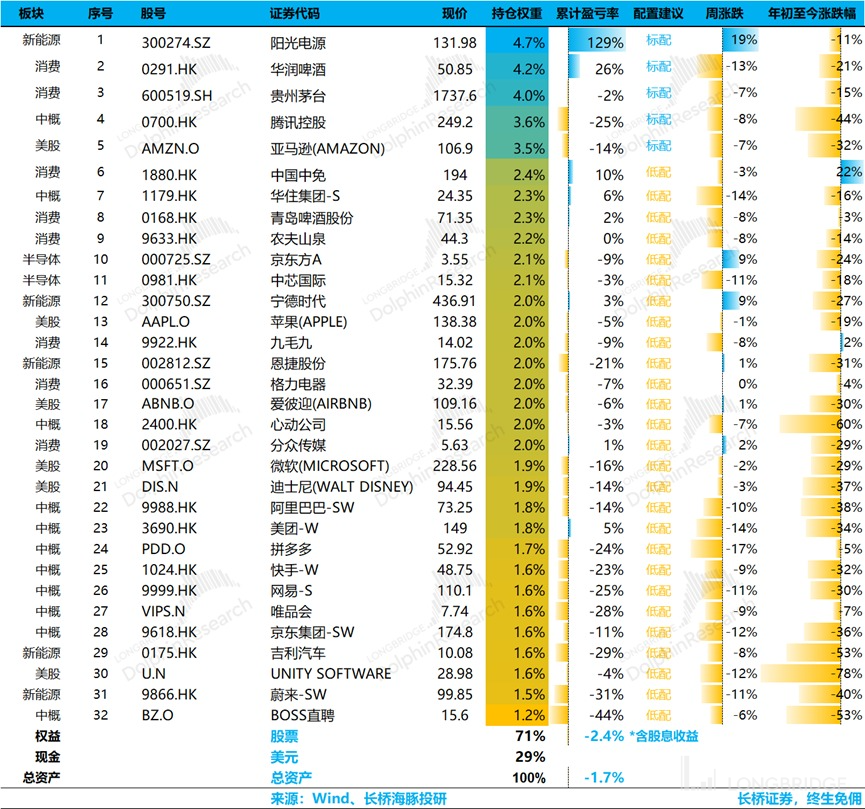
In addition, as mentioned earlier, cyclicals that were at the bottom of the valley have begun to rise, and the reversal logic of the Dolphin Analyst covering Jingdongfang A may also start, so based on the closing price of Monday this week, the Dolphin Analyst will be upgraded Jingdongfang A's weight from underweight to standard in the combination. For detailed logic, please see the table below:

Eight, combination asset distribution
From the launch of the Dolphin Alpha Dolphin Portfolio on March 1st to last week, the overall return of the portfolio was -1.7% (including dividend income), and the return on stock assets was -2.4%.
Currently, the Alpha Dolphin portfolio has a total of 32 stocks, of which only five are standard and 27 are underweight.
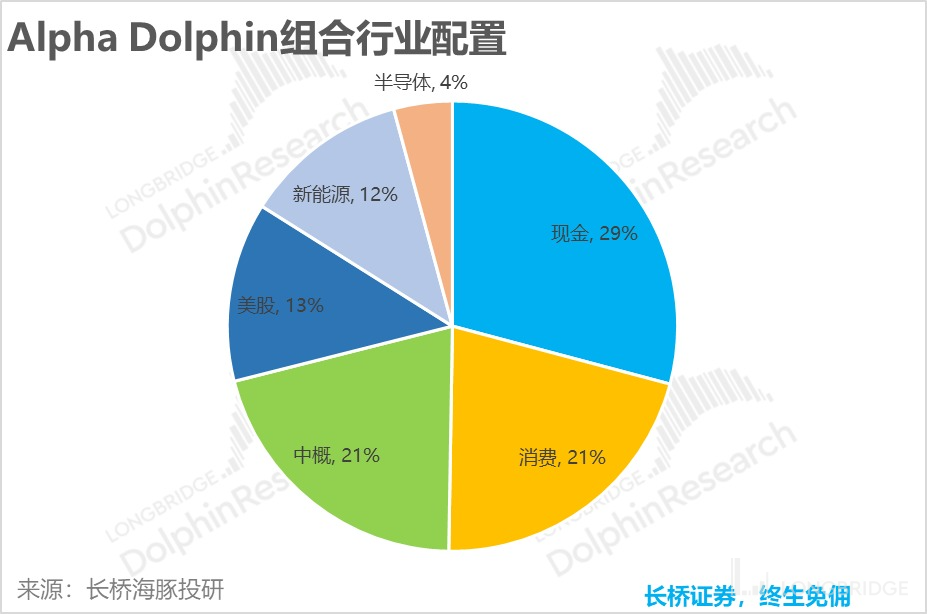
As of the end of last week, the asset allocation and equity asset holding weight of Alpha Dolphin are as follows:


Please refer to the following recent Dolphin Investment Research Portfolio Weekly Reports:
"Slowing down the rate hike? The American Dream is shattered again."
"Reacquaint yourself with a 'iron blood' Federal Reserve."
"Sad second quarter: 'Hawkish' voices were loud, and it's difficult to get through collectively."
"Falling to doubt life, is there still hope for a reversal during despair?"
- Violent Inflation from the Fed, Domestic Consumption Opportunities Instead?
- Global Markets Crash Again, Shortage of Workers is Root Cause in the US
- Fed Becomes the No.1 Bear, Global Markets Collapse
- A Bloodbath Triggered by Rumors: Risks Remain,Finding Sugar in Glass Shards
- US Goes Left, China Goes Right, Cost-Effectiveness of US Assets Returns
- Layoffs are Too Slow to Pick Up, the US Must Continue to Decline
- US Stocks' Celebration of "Funerals": Recession is Good, the Strongest Interest Rate Hike Brings Out the Bearish News
- Interest Rate Hike Enters the Second Half, the Opening of the "Performance Thunder"
- The pandemic Will Strike Back, the US Will Recede, and the Funds Will Change
- Current Chinese Assets: "No News is Good News" for US Stocks
- Growth is Already a Carnival, but is the US Definitely in Recession? 《2023 年的美国,是衰退还是滞涨?》
Risk Disclosure and Disclaimer of This Article: Dolphin Investment Research Disclaimer and General Disclosure


